SPY 2-day bullish forecast — Nov 16, 2026
- Bias: Bullish
- Timeframe: 2 days (made Nov 16, 2026, target date Nov 17, 2026)
- Price at analysis: $740.05
- Price target: $742.00
- Expected range: $732.50 – $749.50
- Result: Incorrect (-1.0%) — closed at $732.44 on Nov 17, 2026; quality score 50/100
Get a free AI analysis of SPY today
Analysis
TECHNICAL INDICATORS
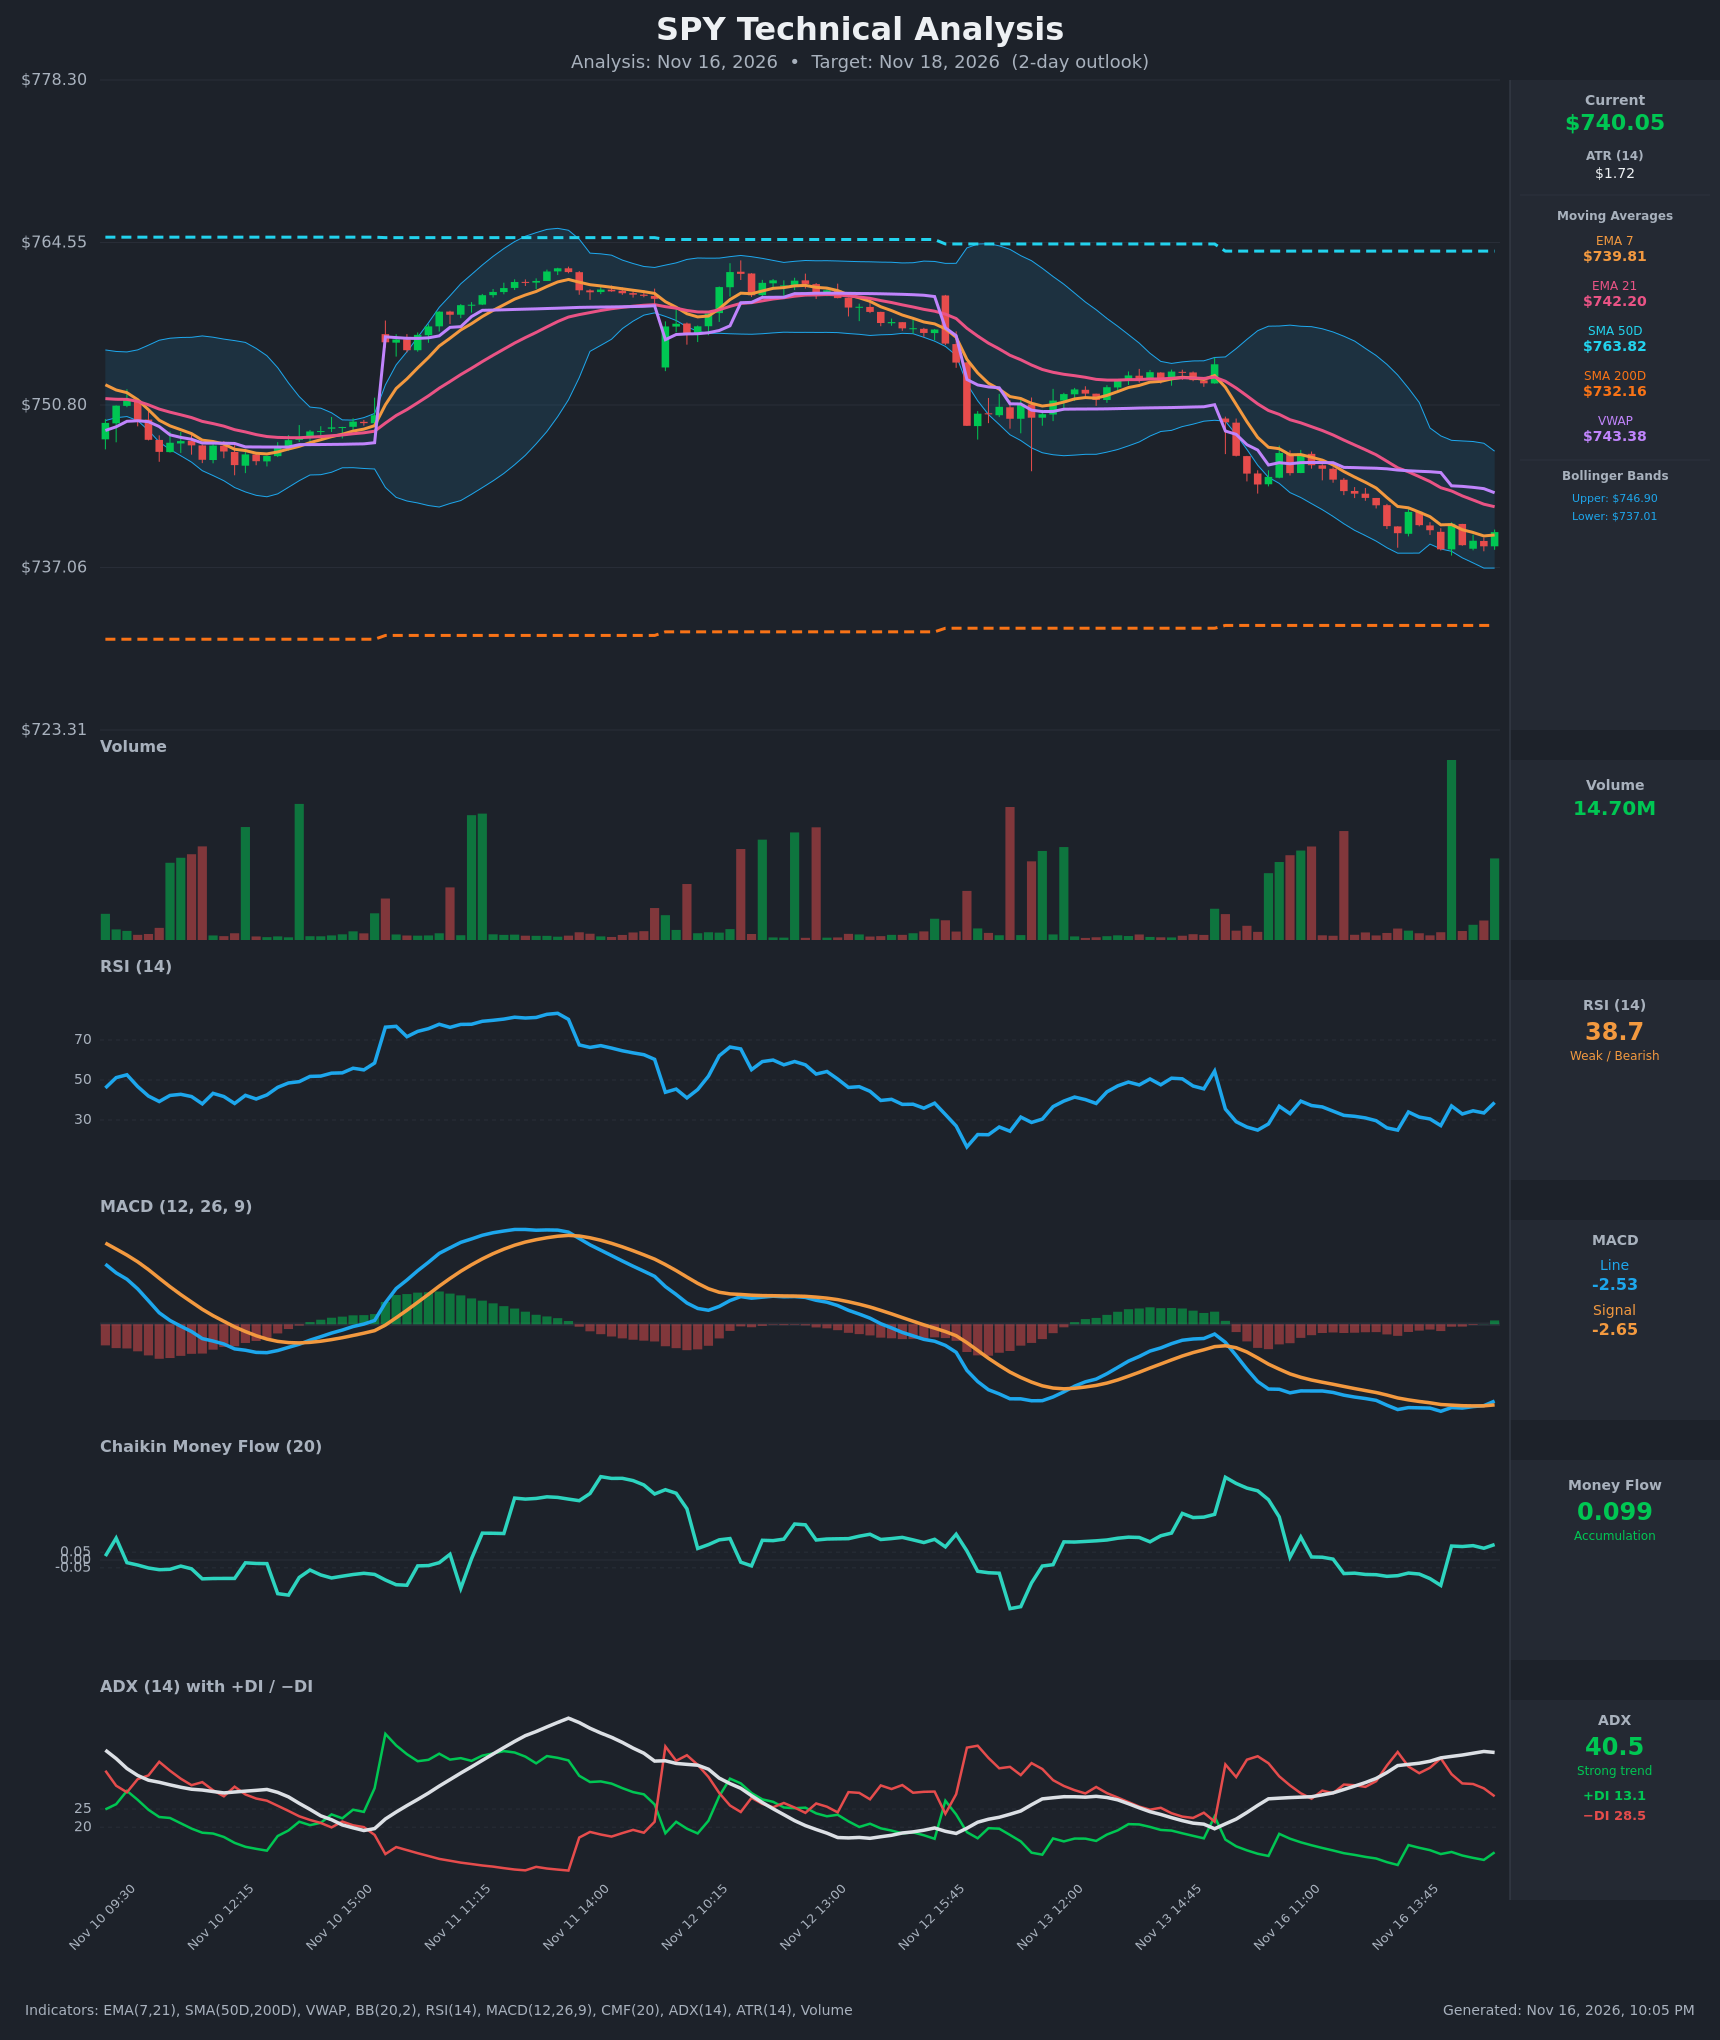
- RSI (14): 38.74, up from a 24.9 oversold low at 13:30 and now bouncing off the bottom. It is still below 50, so the trend is weak, but momentum is improving. [Neutral]
- 20 EMA: EMA 7 is $739.81 and EMA 21 is $742.20. EMA7 is below EMA21 (bearish alignment since the Nov 13 selloff). Price at $740.05 is just above EMA7 and below EMA21, which acts as resistance near $742.20. [Bearish]
- MACD: Line -2.527 is above Signal -2.652, a fresh bullish crossover on the last bar. The histogram has just flipped slightly positive. Both lines are still deeply negative, so this is an early, low-conviction turn. [Bullish]
- Bollinger Bands (20): Upper $746.90, lower $737.01. Price is in the lower quarter of the bands after riding the lower band lower, and the bands are widening. This suggests stretched downside with a mean-reversion bounce toward the midline (~$742) possible. [Neutral]
- CMF (20): 0.099, above +0.05 and positive since 14:45 despite the lower prices. This points to dip buying and accumulation. [Accumulation]
- ADX (14): 40.5 and rising, with −DI (28.5) well above +DI (13.1). This is a strong, established downtrend, though −DI is rolling over from its 40.7 peak. ADX above 40 can also signal trend exhaustion. [Strong Trend - Bearish]
- Volume: The latest bar is 14.70M, the heaviest volume on the chart, and it is green. This looks like a high-volume reversal or absorption bar at the lows. [Bullish tilt / possible capitulation]
- VWAP / SMA context: Price is below VWAP ($743.38), which is bearish intraday. It is far below SMA50D ($763.82), but above SMA200D ($732.16), so the long-term uptrend structure holds. There is no death cross, since SMA50 is above SMA200. [Mixed]
DIVERGENCES & TRENDS
- Bullish RSI divergence: Price made lower lows around $738.59–$738.85, while RSI rose from 24.9 to 38.7.
- Bullish MACD divergence: The MACD line has stopped making new lows and crossed above its signal.
- CMF divergence: CMF has turned positive (0.099) while price keeps drifting lower, a sign of accumulation under the surface.
- Trend: The Nov 13–16 trend is clearly down, with lower highs and lower lows. EMA7 is below EMA21, price is below VWAP, and ADX is strong with −DI dominant.
- Crossovers: MACD has turned bullish, but EMA7/EMA21 and +DI/−DI are still bearish. No major SMA crossover has occurred.
CHART PATTERNS
- Descending channel / Bullish Falling Wedge (reference diagram): Since Nov 13, price has made lower highs and lower lows, with RSI and MACD momentum improving at the lows. If the wedge resolves upward, the target is a retracement to the EMA21/VWAP zone ($742–$743.50), and eventually the upper Bollinger band ($746.90).
- Counter-read, Bearish Flag/Continuation: The slow grind lower after the sharp Nov 13 drop could be a bearish continuation. A break below $737 would target the SMA200D at ~$732.
- The pattern is not yet confirmed. A break above $742.20 would validate the wedge.
POTENTIAL SCENARIOS
- Scenario 1: Bullish Oversold Bounce — Bullish divergences, the MACD cross, positive CMF and a high-volume green bar at the lower Bollinger band point to a mean-reversion rally toward EMA21 and VWAP. Trigger: hold above $738.50 and close above EMA21 at $742.20. Target: $742.00–$743.50, with an extension to $746 (BB upper). Invalidation: a close below $737.00. (45% probability)
- Scenario 2: Bearish Trend Continuation — ADX of 40 with −DI dominant and price below all short-term averages could extend the drop. Trigger: a break below the lower BB at $737.01 and failure at EMA21 resistance. Target: $734.00, then the SMA200D at $732.16. Invalidation: a close above $743.40 (VWAP). (40% probability)
- Scenario 3: Neutral Chop — Price consolidates between the lower BB and EMA21 as the bounce and the trend offset each other. Trigger: low-volume drift. Target: $738–$742. Invalidation: a break outside this band on volume. (15% probability)
PRICE TARGETS
- Target Price: $742.00 (2-day)
- Expected Range: $732.50 to $749.50 (width $17.00, about 2.3% of the current price, consistent with the 2–3 day guidance)
- Key Levels: Support at $737.01 (lower Bollinger band; SMA200D at $732.16 below it), Resistance at $742.20 (EMA 21; VWAP at $743.38 above it)
OVERALL BIAS
OVERALL BIAS: BULLISH - Bullish RSI/MACD divergences, positive CMF accumulation and a heavy green bar at the lower Bollinger band favor a bounce toward $742. The strong ADX downtrend (−DI dominant) and the EMA21/VWAP overhead resistance cap the upside, so conviction is modest.
This is educational analysis and not financial advice.