SPY 1-day bullish forecast — Nov 17, 2026
- Bias: Bullish
- Timeframe: 1 day (made Nov 17, 2026, target date Nov 18, 2026)
- Price at analysis: $740.05
- Price target: $741.50
- Expected range: $732.80 – $750.30
- Result: Incorrect (-1.0%) — closed at $732.44 on Nov 18, 2026; quality score 46/100
Get a free AI analysis of SPY today
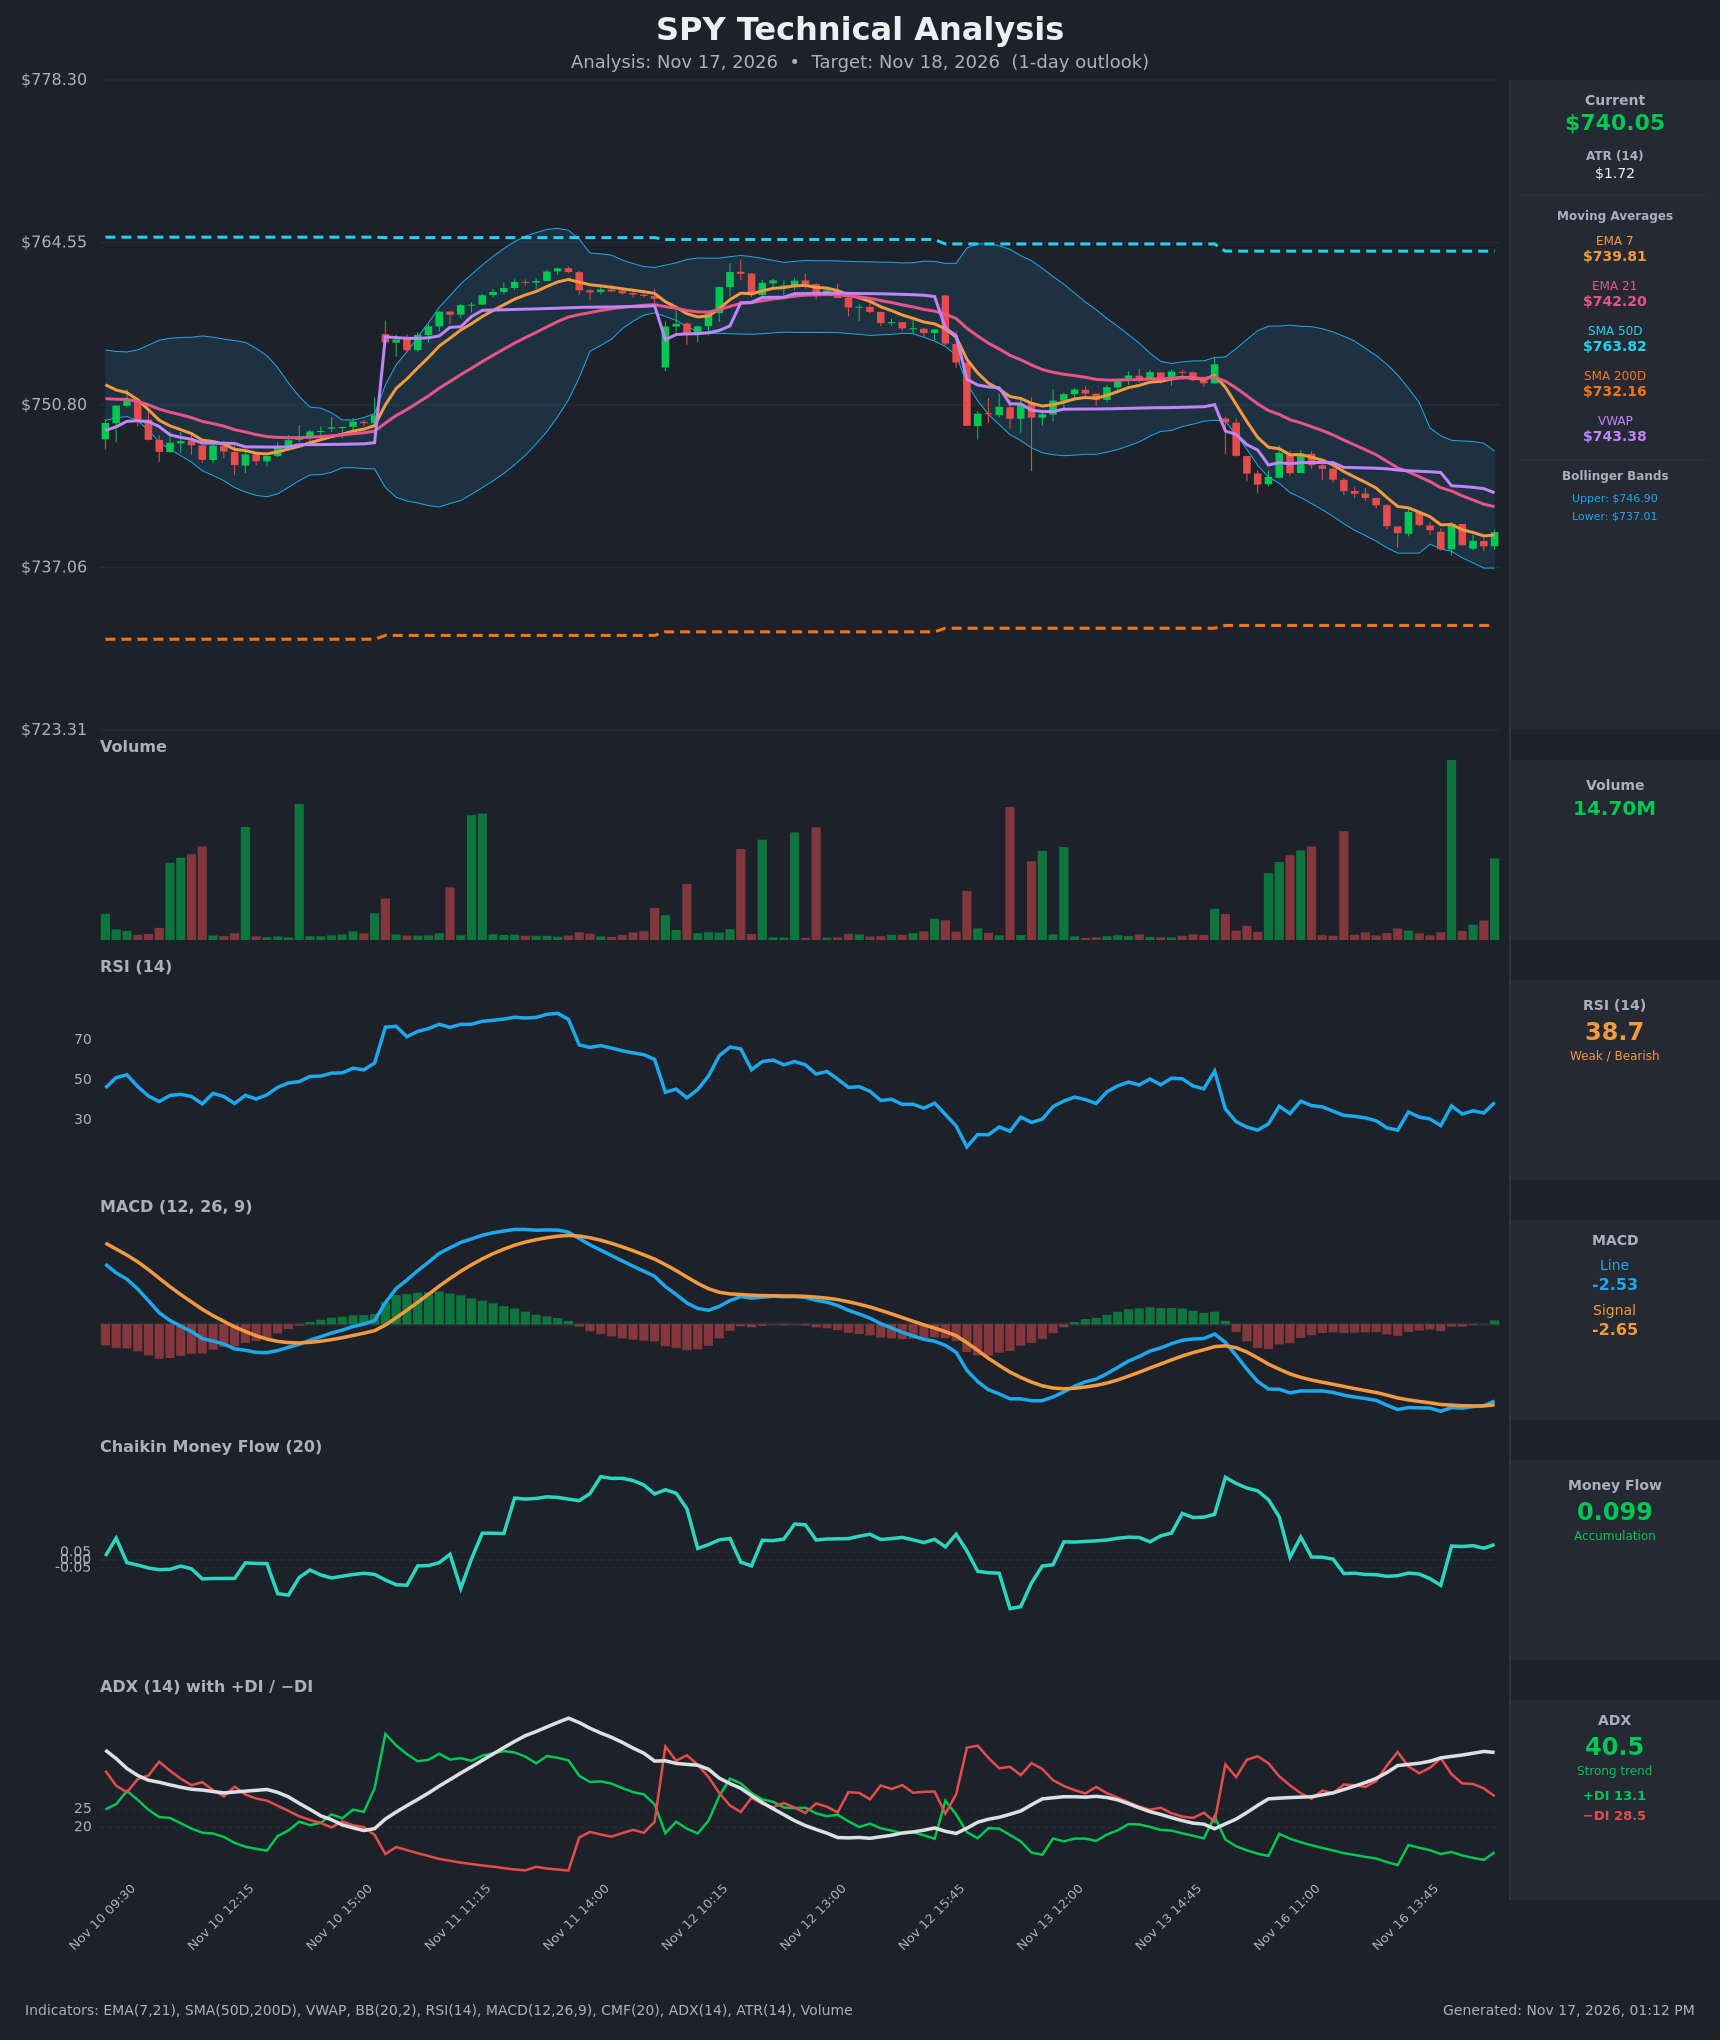
Analysis
TECHNICAL INDICATORS
- RSI (14): 38.74, up from a low of about 25 at 13:30 and from 33.5 on the prior bar. It is still below 50 but has lifted off oversold, so downside momentum is easing. [Neutral]
- Moving Averages: Price of $740.05 is just above EMA 7 ($739.81), which is flat and acting as near-term support. It is below EMA 21 ($742.20), VWAP ($743.38) and SMA 50D ($763.82), all of which are overhead resistance. Price is above SMA 200D ($732.16), which is the key long-term support. EMA 7 is below EMA 21 (a bearish cross that is still in force), and SMA 50D is well above SMA 200D, so there is no death cross. The gap between EMA 7 and EMA 21 is narrowing, and a rebound could flatten it. [Bearish]
- MACD: Line -2.527 is above signal -2.652, a fresh bullish crossover on the last bar. The histogram has just turned positive (about +0.125). Both lines are still deeply negative, so this is an early, low-conviction turn. [Bullish]
- Bollinger Bands (20): Bands are $737.01 to $746.90, and price is in the lower third, having hugged or tagged the lower band during the selloff. The bands are wide, which fits an elevated-volatility trend leg. The lower band marks short-term support and the mid-band (about $742) is the first mean-reversion target. [Neutral]
- CMF (20): 0.099, above the +0.05 threshold and positive for the last five bars despite falling prices. This suggests dip buying on the recent leg lower. [Accumulation]
- ADX (14): 40.5 (strong trend) with −DI 28.5 above +DI 13.1. Sellers still control the trend. ADX has plateaued at about 40, and the DI spread has narrowed from 31.9/11.0, suggesting the selling is losing some force. [Strong Trend – Bearish]
- Volume: 14.70M on the latest bar, among the heavier prints of the last few sessions, and it came on a green candle at the lows. That is a possible absorption or capitulation signal, but a single bar is not confirmation. [Mildly Bullish]
DIVERGENCES & TRENDS
- Bullish divergence (mild): Price made lower lows from Nov 16 13:30 to 15:30 (about $739.96 down to $738.85), while RSI held above its 24.9 low and MACD histogram flipped positive. CMF has also stayed positive through the decline.
- Trend: The short-term trend is clearly down. Price has made lower highs and lower lows since Nov 13 and sits below EMA 21 and VWAP. ADX at 40 confirms an established trend, not a range.
- Crossovers: The MACD bullish crossover is brand new. +DI is still far below −DI, and EMA 7 remains below EMA 21.
- Momentum: RSI is rising off the lows and MACD is curling up, so a relief bounce is the base case. Reclaiming EMA 21 would be needed to turn the near-term structure.
CHART PATTERNS
- Descending channel / bearish continuation: The series of lower highs and lows since Nov 13 resembles the bearish flag or channel structure in the reference diagram. Continuation would break the lower band at $737 and aim toward $732 (SMA 200D).
- Possible Bullish Falling Wedge (early): Price has been compressing along the lower Bollinger Band with narrowing swings and a volume spike. If price breaks above the upper wedge boundary near EMA 21 ($742.20), the reversal target is the VWAP and mid-band area of $743–$745. This is not confirmed yet.
- No completed reversal pattern is in place, so pattern evidence is mixed.
POTENTIAL SCENARIOS
- Scenario 1: Bullish Relief Bounce — The MACD crossover, positive CMF and the oversold RSI bounce lead to mean reversion toward EMA 21 and VWAP. Trigger: a hold above $739.80 and a move through $742.20. Target: $743.40 to $745. Invalidation: a close below $737.00. (45% probability)
- Scenario 2: Bearish Trend Continuation — The strong ADX downtrend resumes, with −DI dominant and price rejected at EMA 21 or VWAP. Trigger: a break below the lower Bollinger Band at $737.01. Target: $732 to $734 (SMA 200D area). Invalidation: a close above $743.40. (40% probability)
- Scenario 3: Neutral Consolidation — Price chops between the lower band and EMA 21 and settles near the current level. Trigger: low volume and a flat MACD. Target: $738 to $742. Invalidation: a break outside that band on volume. (15% probability)
PRICE TARGETS
- Target Price: $741.50 (1-day horizon)
- Expected Range: $732.80 to $750.30 (about 2x the ~$8.77 typical move wide, shifted slightly up toward the target)
- Key Levels: Support at $737.01, Resistance at $742.20
OVERALL BIAS
OVERALL BIAS: BULLISH - Early momentum improvement (fresh MACD bullish crossover, RSI rising off oversold, positive CMF, a heavy-volume bounce at the lower Bollinger Band) favors a modest relief move toward EMA 21 and VWAP. The strong ADX downtrend with −DI in control keeps conviction low, and a break below $737 would flip the view.
This is educational analysis and not financial advice.