AMZN 47-day bearish forecast — Oct 30, 2026
- Bias: Bearish
- Timeframe: 47 days (made Oct 30, 2026, target date Dec 16, 2026)
- Price at analysis: $239.26
- Price target: $232.00
- Expected range: $217.00 – $253.00
- Result: Pending — graded after the close on Dec 16, 2026
Get a free AI analysis of AMZN today
Analysis
TECHNICAL INDICATORS
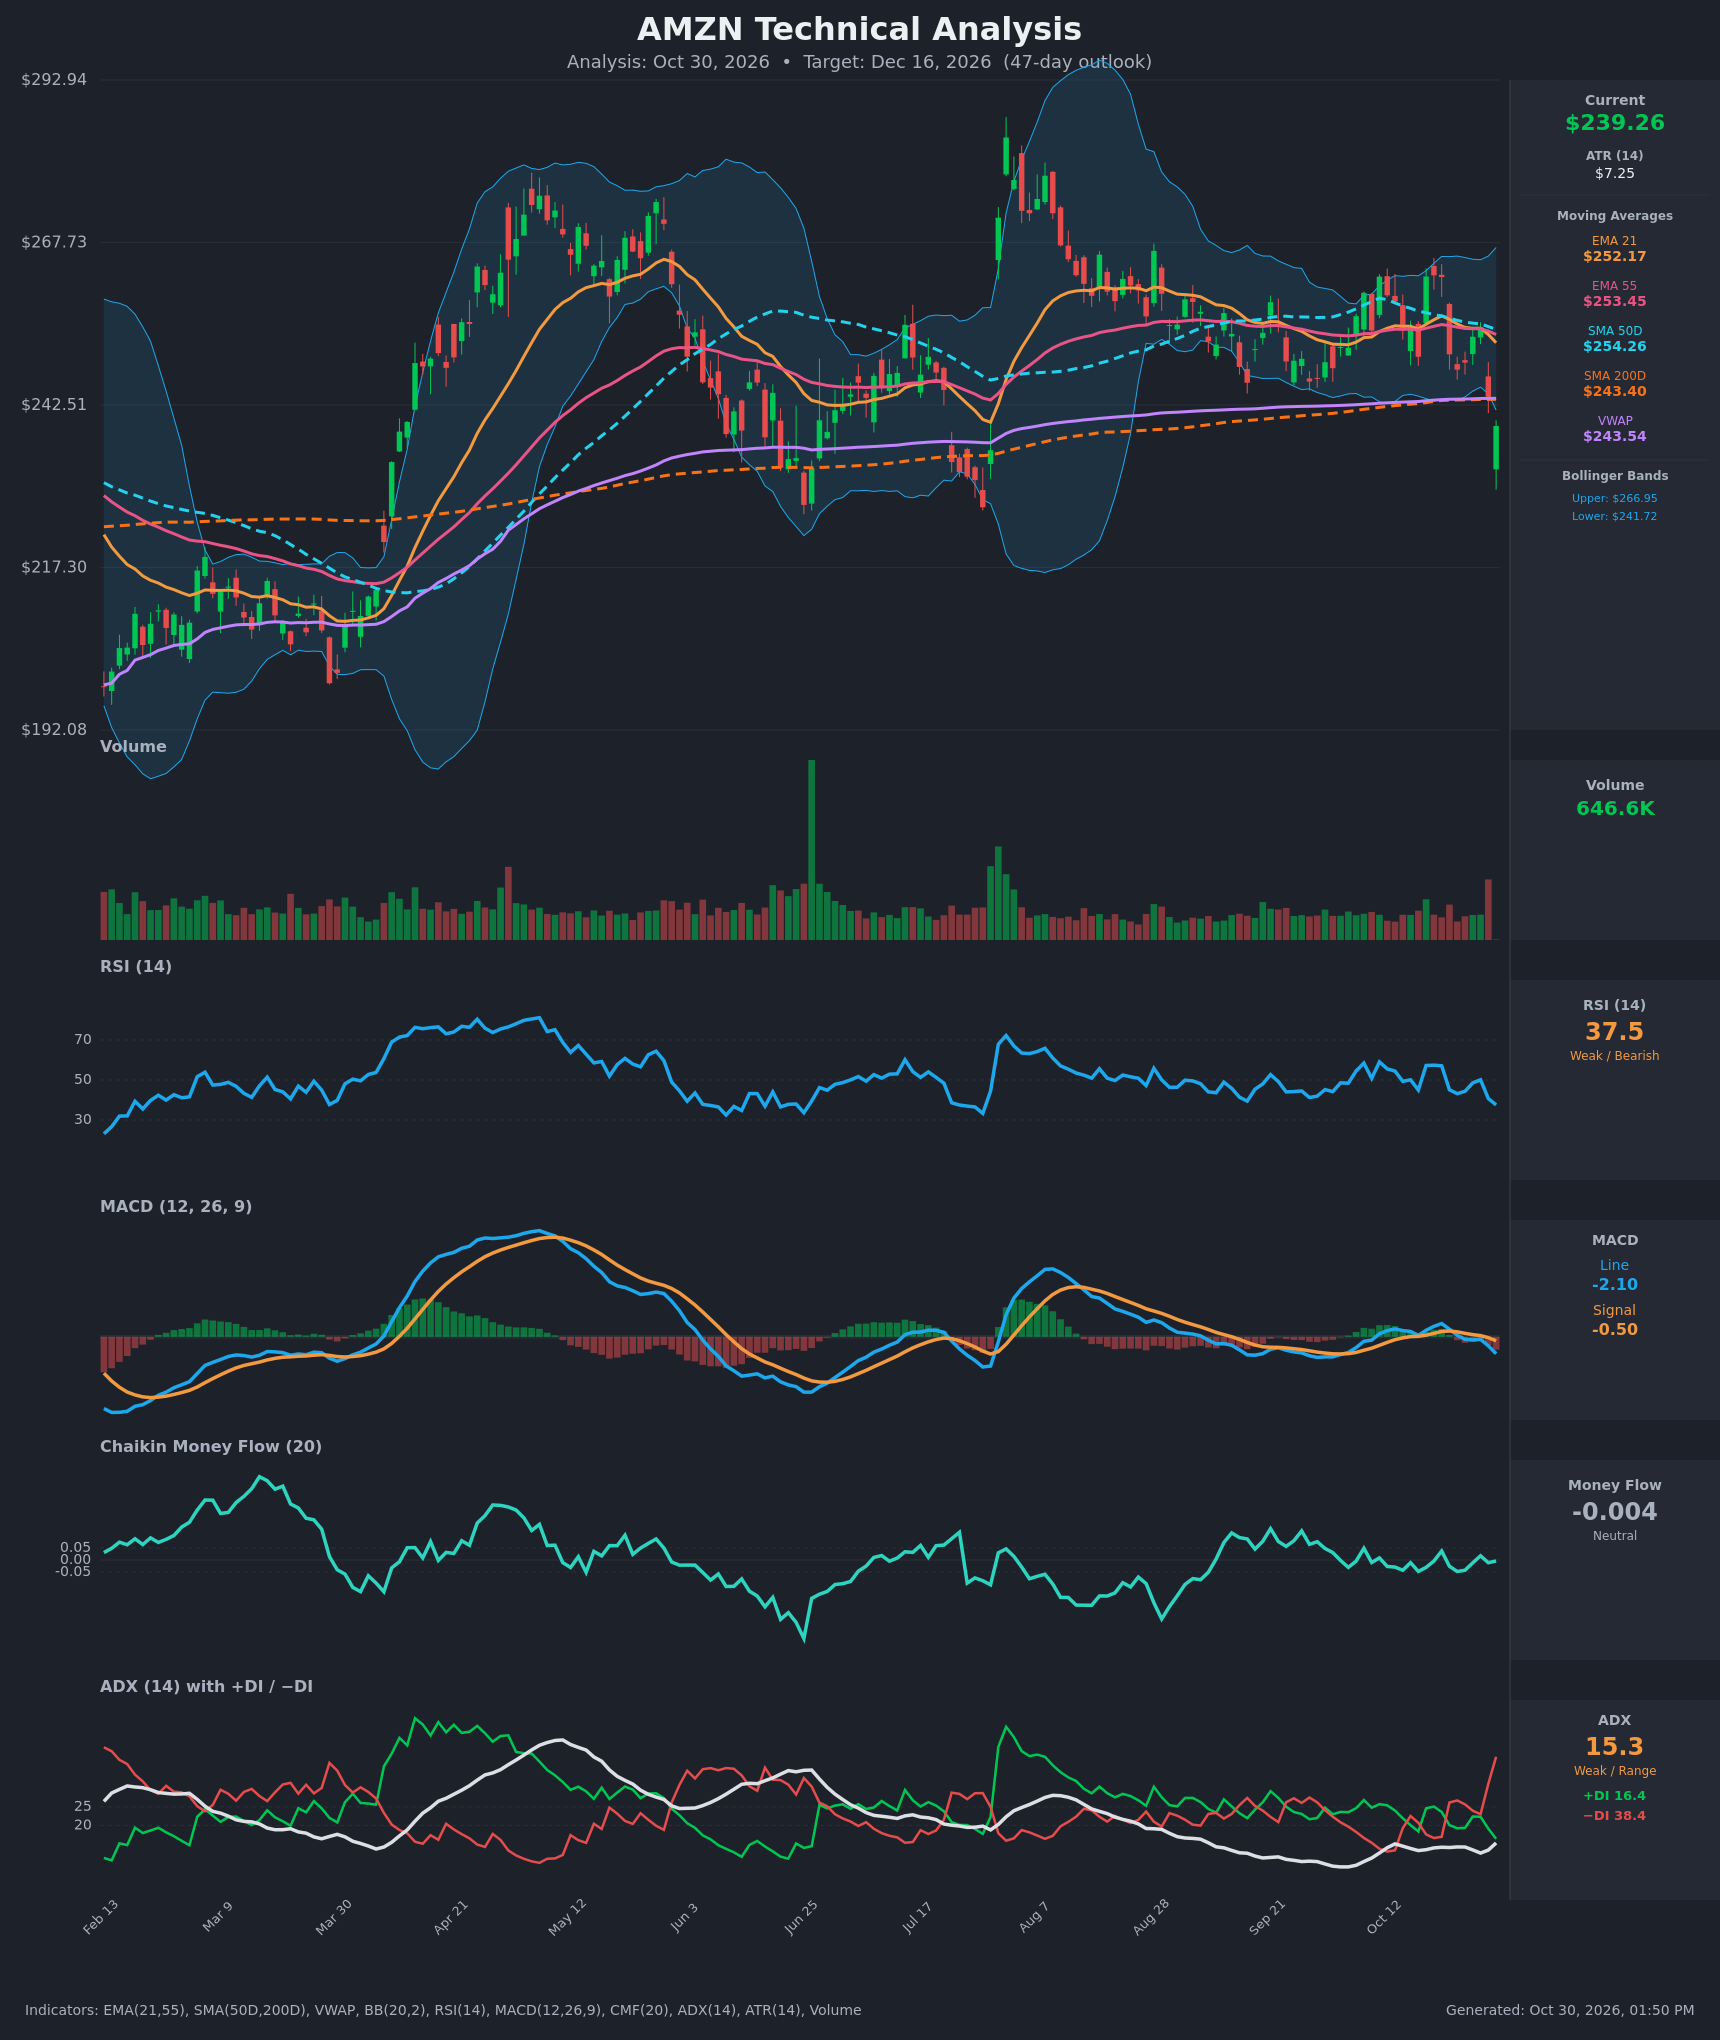
- RSI (14): 37.55, down from 50.1 on Oct 28 and 57 on Oct 21. It is falling steadily toward the 30 oversold line but is not oversold yet, so there is room to fall further. [Bearish]
- 20 EMA (EMA 21 = $252.17): Price at $239.26 is about 5% below it. EMA 21 crossed below EMA 55 ($253.45) on Oct 29 and is now sloping down, so it acts as overhead resistance. [Bearish]
- MACD: Line -2.10, signal -0.50, histogram about -1.60. The line crossed below the signal on Oct 23 and below zero on Oct 26, and the gap is widening. [Bearish]
- Bollinger Bands (20): The upper band is $266.95 and the lower band is $241.72. Price closed below the lower band after a gap-down candle, which is a volatility expansion to the downside. The bands are fairly narrow compared with the summer, so a larger move is plausible. A close below the lower band can mean a relief bounce or a trend-continuation walk, and the weak ADX leans toward a bounce attempt. [Bearish]
- CMF (20): -0.004, flat and inside the ±0.05 neutral zone. There is no clear accumulation or distribution, and the indicator has hovered near zero for months. Money flow has not yet confirmed the price breakdown. [Neutral]
- ADX (14): 15.3 and just starting to turn up from the lows. −DI at 38.4 is far above +DI at 16.4, and the DI crossover to bearish happened on Oct 22. ADX is below 20, so the trend is not yet established, but the directional pressure is clearly with sellers. [Weak Trend, Bearish Direction]
- Volume: 646.6K on the last bar, which looks above the recent average and is a red bar on a gap-down. The decline is on heavier volume, which supports the breakdown. The bar may not be a full session, so treat it with some caution. [Bearish]
Other levels:
- SMA 200 / VWAP: Price is below the SMA 200 ($243.40) and VWAP ($243.54). Both sit overhead and now act as resistance, with price breaking under them.
- SMA 50: At $254.26 it is still above the SMA 200, so the golden cross remains intact. It is flattening and rolling over.
DIVERGENCES & TRENDS
- There is no bullish RSI or MACD divergence. Both indicators made lower highs along with price over October, so momentum confirms price.
- Price is making lower highs, from $262.6 to $254.6, and a lower low at $239.26. The Aug–Oct range floor near $245 has broken.
- Key crossovers:
- MACD bearish cross (Oct 23).
- DI bearish cross (Oct 22).
- EMA 21 below EMA 55 (Oct 29).
- Price below the SMA 200 and VWAP (Oct 30).
- CMF is flat, and ADX is low but turning up. Money flow has not confirmed the move, which leaves a risk of a mean-reversion bounce.
- The SMA 200 has been rising slowly and has repeatedly acted as support (June, July). A loss of it is a meaningful technical break.
CHART PATTERNS
- Bearish Double Top / Triple Top (reversal): Highs near $262–263 (Oct 19–21) sit just under the earlier ~$263–265 area. The neckline is around $245–248, and the gap-down candle breaks it. The measured move is about $17 (the height from ~$263 to ~$246), which projects to roughly $228–230.
- Range breakdown: Price consolidated between about $245 and $265 from Aug to Oct. A decisive close below the range floor on heavy volume is a bearish continuation of the post-August distribution.
- Counter-view: The gap candle could be a one-bar flush below the lower band and the SMA 200 that gets retraced. A close back above $243.5–245 would turn this into a failed breakdown (a bear trap).
POTENTIAL SCENARIOS
- Scenario 1: Bearish Breakdown Continuation — The double-top neckline break and the loss of the SMA 200 and VWAP lead to a measured move lower. Any bounces stall at the SMA 200 and VWAP near $243.5. Trigger: Failure to reclaim $243.5–245 and a close below $236. Target: $228–230 first, then $225–226 (July lows). Invalidation: Daily close above $246 on rising volume. (50% probability)
- Scenario 2: Bullish Relief Bounce / Failed Breakdown — Price is stretched below the lower Bollinger Band with RSI approaching 30 and a very weak ADX, so mean reversion toward the moving averages is plausible. Trigger: Reclaim of $243.5–245 (SMA 200 and VWAP). Target: $252–254 (EMA 21/55 and SMA 50 cluster). Invalidation: Rejection at $245 followed by a close below $236. (30% probability)
- Scenario 3: Neutral Choppy Base — Price oscillates between about $228 and $248 as the ADX stays low. Trigger: Stabilization with RSI holding 35–45. Target: $235–245 range. Invalidation: Close below $226 or above $254. (20% probability)
PRICE TARGETS
For the 47-day horizon, the range width should be about 12–18% of current price. The range below is $217.00 to $253.00, a $36 width, or about 15.0%.
- Target Price: $232.00 (47 days, Dec 16, 2026)
- Expected Range: $217.00 to $253.00
- Key Levels: Support at $226.00 (July swing lows), Resistance at $243.40 (SMA 200, with VWAP just above at $243.54)
OVERALL BIAS
OVERALL BIAS: BEARISH - Price broke the Aug–Oct range floor and closed below the SMA 200, VWAP and lower Bollinger Band. MACD and the DI lines are bearish, EMA 21 has crossed under EMA 55, and the double-top measured move points to about $228–230. The low ADX and neutral CMF argue for modest conviction and a possible relief bounce toward $243–245.
This is educational analysis and not financial advice.