AMZN 83-day bullish forecast — Nov 15, 2026
- Bias: Bullish
- Timeframe: 83 days (made Nov 15, 2026, target date Feb 5, 2027)
- Price at analysis: $266.66
- Price target: $279.00
- Expected range: $238.00 – $300.00
- Result: Pending — graded after the close on Feb 5, 2027
Get a free AI analysis of AMZN today
Analysis
TECHNICAL INDICATORS
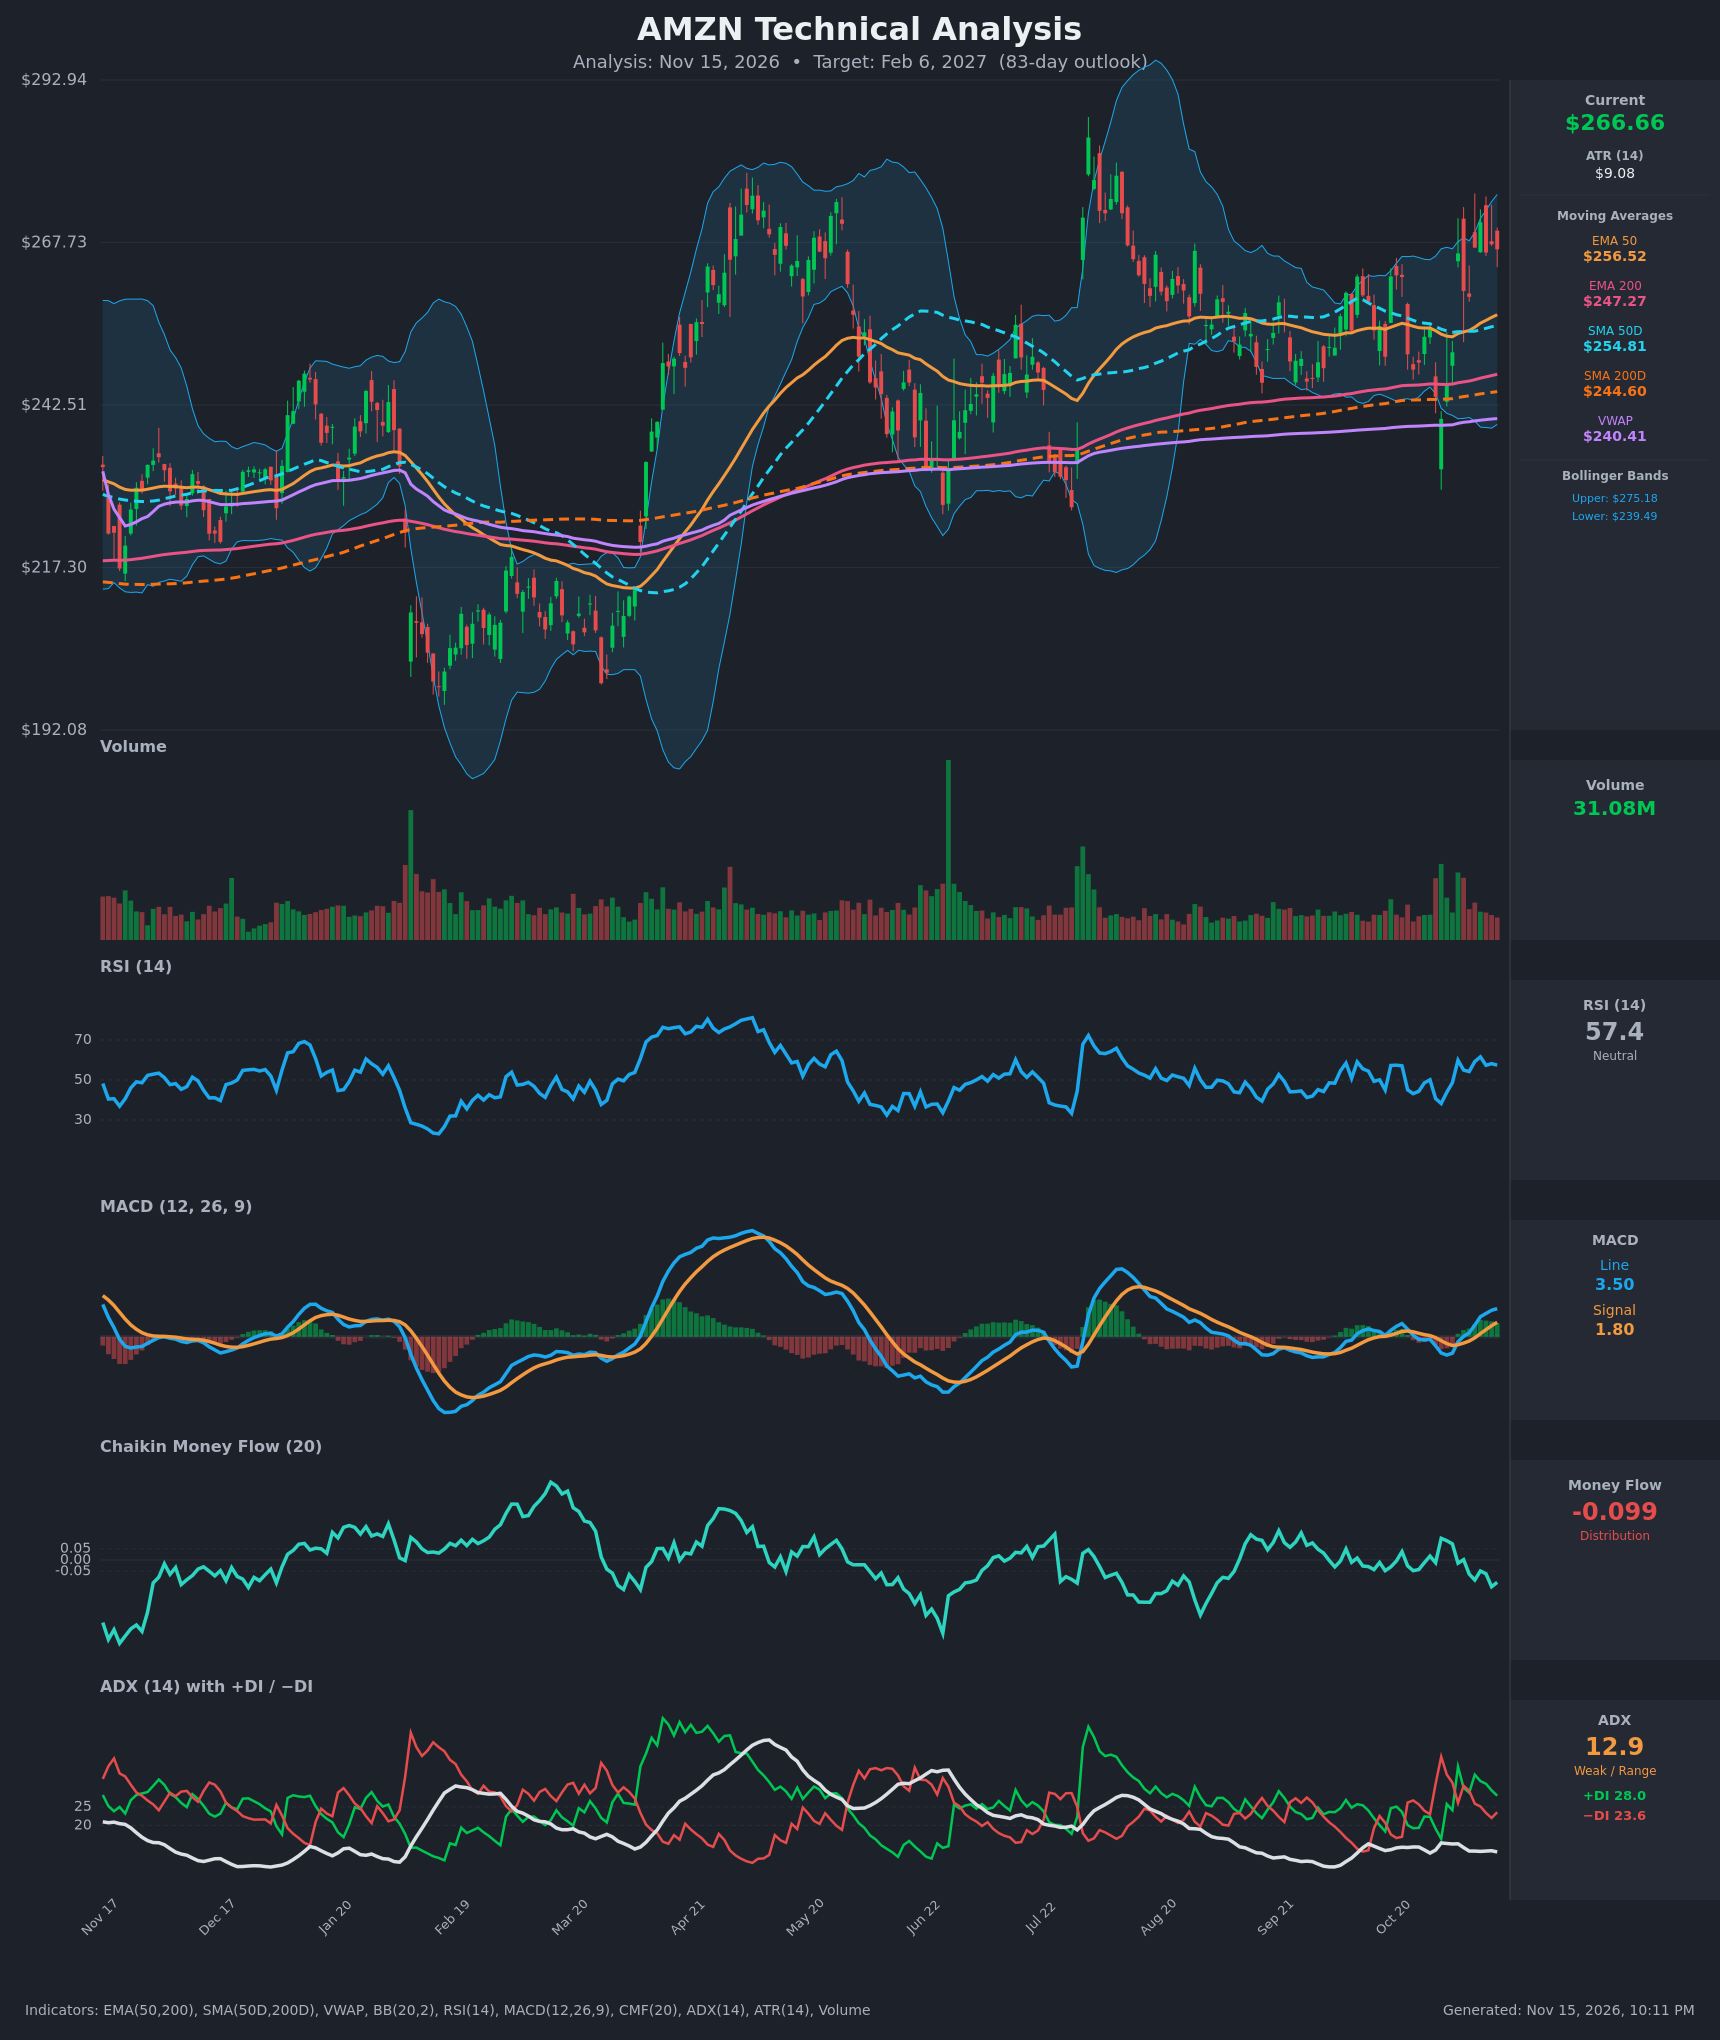
- RSI (14): 57.4, a neutral-to-constructive reading with room before the 70 overbought line. It rose from 38 on Oct 30 to the high 50s and has been flat around 57-61 over the last five sessions, so momentum is recovering but not stretched. [Bullish]
- 20 EMA: No 20 EMA value was supplied, so I use the EMA 50 at $256.52 as the nearest trend gauge. Price at $266.66 is about 4% above it and the EMA 50 is rising. It is also above the EMA 200 ($247.27), so the structure is bullish. [Bullish]
- MACD: The line (3.50) is above the signal (1.80) after a bullish crossover on Nov 5, and the histogram has widened to about +1.7. The line is above zero and rising, which is a clean momentum upswing. [Bullish]
- Bollinger Bands (20): Bands run $239.49 to $275.18, so price sits in the upper half, about 75% of the way up the band, with no squeeze. The recent peaks near $270 have stalled below the upper band. The mid-band (about $257) is the pullback support. [Neutral]
- CMF (20): -0.099 is in distribution territory (below -0.05), and it has been falling from positive readings in early November (+0.09) even as price rose. Volume flow is not confirming the rally. [Distribution]
- ADX (14): 12.9 is well below 20, so there is no established trend and the market is range-bound. +DI (28.0) is above −DI (23.6), giving a mild bullish lean, but the spread is narrow and trend conviction is low. [Weak Trend, mild bullish lean]
- Volume: 31.08M is modest and in line with the typical range. The only heavy volume in the past month came on the Nov 4 gap-up (+6%), a bullish event, but follow-through volume has faded. There is no climactic participation either way. [Neutral / slightly supportive of Nov 4 breakout]
DIVERGENCES & TRENDS
- Bearish CMF divergence: Price made higher highs ($266 on Nov 4, $270.87 on Nov 10) while CMF moved from +0.09 to -0.10. This is the main warning sign and suggests rallies are being sold into.
- MACD/RSI: Both confirm the upswing. MACD crossed up on Nov 5 and RSI is making higher lows from 38 to 57. There is no RSI divergence yet.
- Moving averages: EMA 50 > EMA 200 and SMA 50D ($254.81) > SMA 200D ($244.60) is a bullish, stacked alignment. All averages are rising and price is above all of them and above VWAP ($240.41). The SMA golden cross is already established, not new.
- DI/ADX: The −DI > +DI regime of Oct 29-Nov 3 flipped back to +DI on Nov 4. ADX is still sub-15, so this is a low-conviction trend.
- Range context: Since July, price has oscillated between roughly $240 and $275, with a lower-high sequence from the $285+ July spike. The $270-$275 zone is the ceiling.
CHART PATTERNS
- Ascending triangle / range breakout attempt (reference: Ascending Triangle): Higher lows (Oct 30 at $240 → Nov 3 at $250 → Nov 6 at $259) are pressing against flat resistance at $270-$272. A confirmed close above ~$272-$275 would project a measured move of roughly the triangle height (about $30), targeting $295-$300.
- Possible Bearish Double Top (reference): The $270.87 peak (Nov 10) and the recent test near $270 form a potential double top. A close below the neckline at about $259 (the Nov 6 low) would target about $248.
- Broader structure: On the 83-day horizon the long-term trend is up, with all averages stacked bullishly. The ADX reading and CMF argue for continued choppiness before any breakout.
POTENTIAL SCENARIOS
- Scenario 1: Bullish Breakout Above $275 — Price clears the $270-$275 ceiling and the upper Bollinger Band, supported by the bullish MACD and the stacked rising averages, and trends toward the prior high zone. Trigger: daily close above $275 on expanding volume. Target: $290-$300. Invalidation: close back below $256 (EMA 50 / SMA 50D). (50% probability)
- Scenario 2: Neutral Range-Bound Consolidation — ADX stays weak and price chops between the 50-day averages and the $275 ceiling. Trigger: repeated rejections near $270-$275 with support holding at $255. Target: $255-$275. Invalidation: a decisive break of either boundary. (22% probability)
- Scenario 3: Bearish Double-Top Breakdown — Persistent CMF distribution wins out and price loses the $259 neckline and the 50-day averages, falling toward the 200-day averages. Trigger: close below $254 with MACD crossing below its signal. Target: $240-$245. Invalidation: reclaim of $272. (28% probability)
PRICE TARGETS
- Target Price: $279.00 (83-day horizon, about +4.6%)
- Expected Range: $238.00 to $300.00 (width $62, about 23% of current price, consistent with the 61-180 day guidance)
- Key Levels: Support at $256.50, Resistance at $275.00
OVERALL BIAS
OVERALL BIAS: BULLISH - Price is above all key moving averages with a stacked golden-cross structure, a fresh bullish MACD crossover, +DI above −DI, and higher lows pressing the $270-$275 resistance. Conviction is modest because of weak ADX and CMF distribution, so the ceiling at $275 must be cleared.
This is educational analysis and not financial advice.