AMZN 34-day bearish forecast — Nov 15, 2026
- Bias: Bearish
- Timeframe: 34 days (made Nov 15, 2026, target date Dec 18, 2026)
- Price at analysis: $266.66
- Price target: $259.50
- Expected range: $240.00 – $281.00
- Result: Pending — graded after the close on Dec 18, 2026
Get a free AI analysis of AMZN today
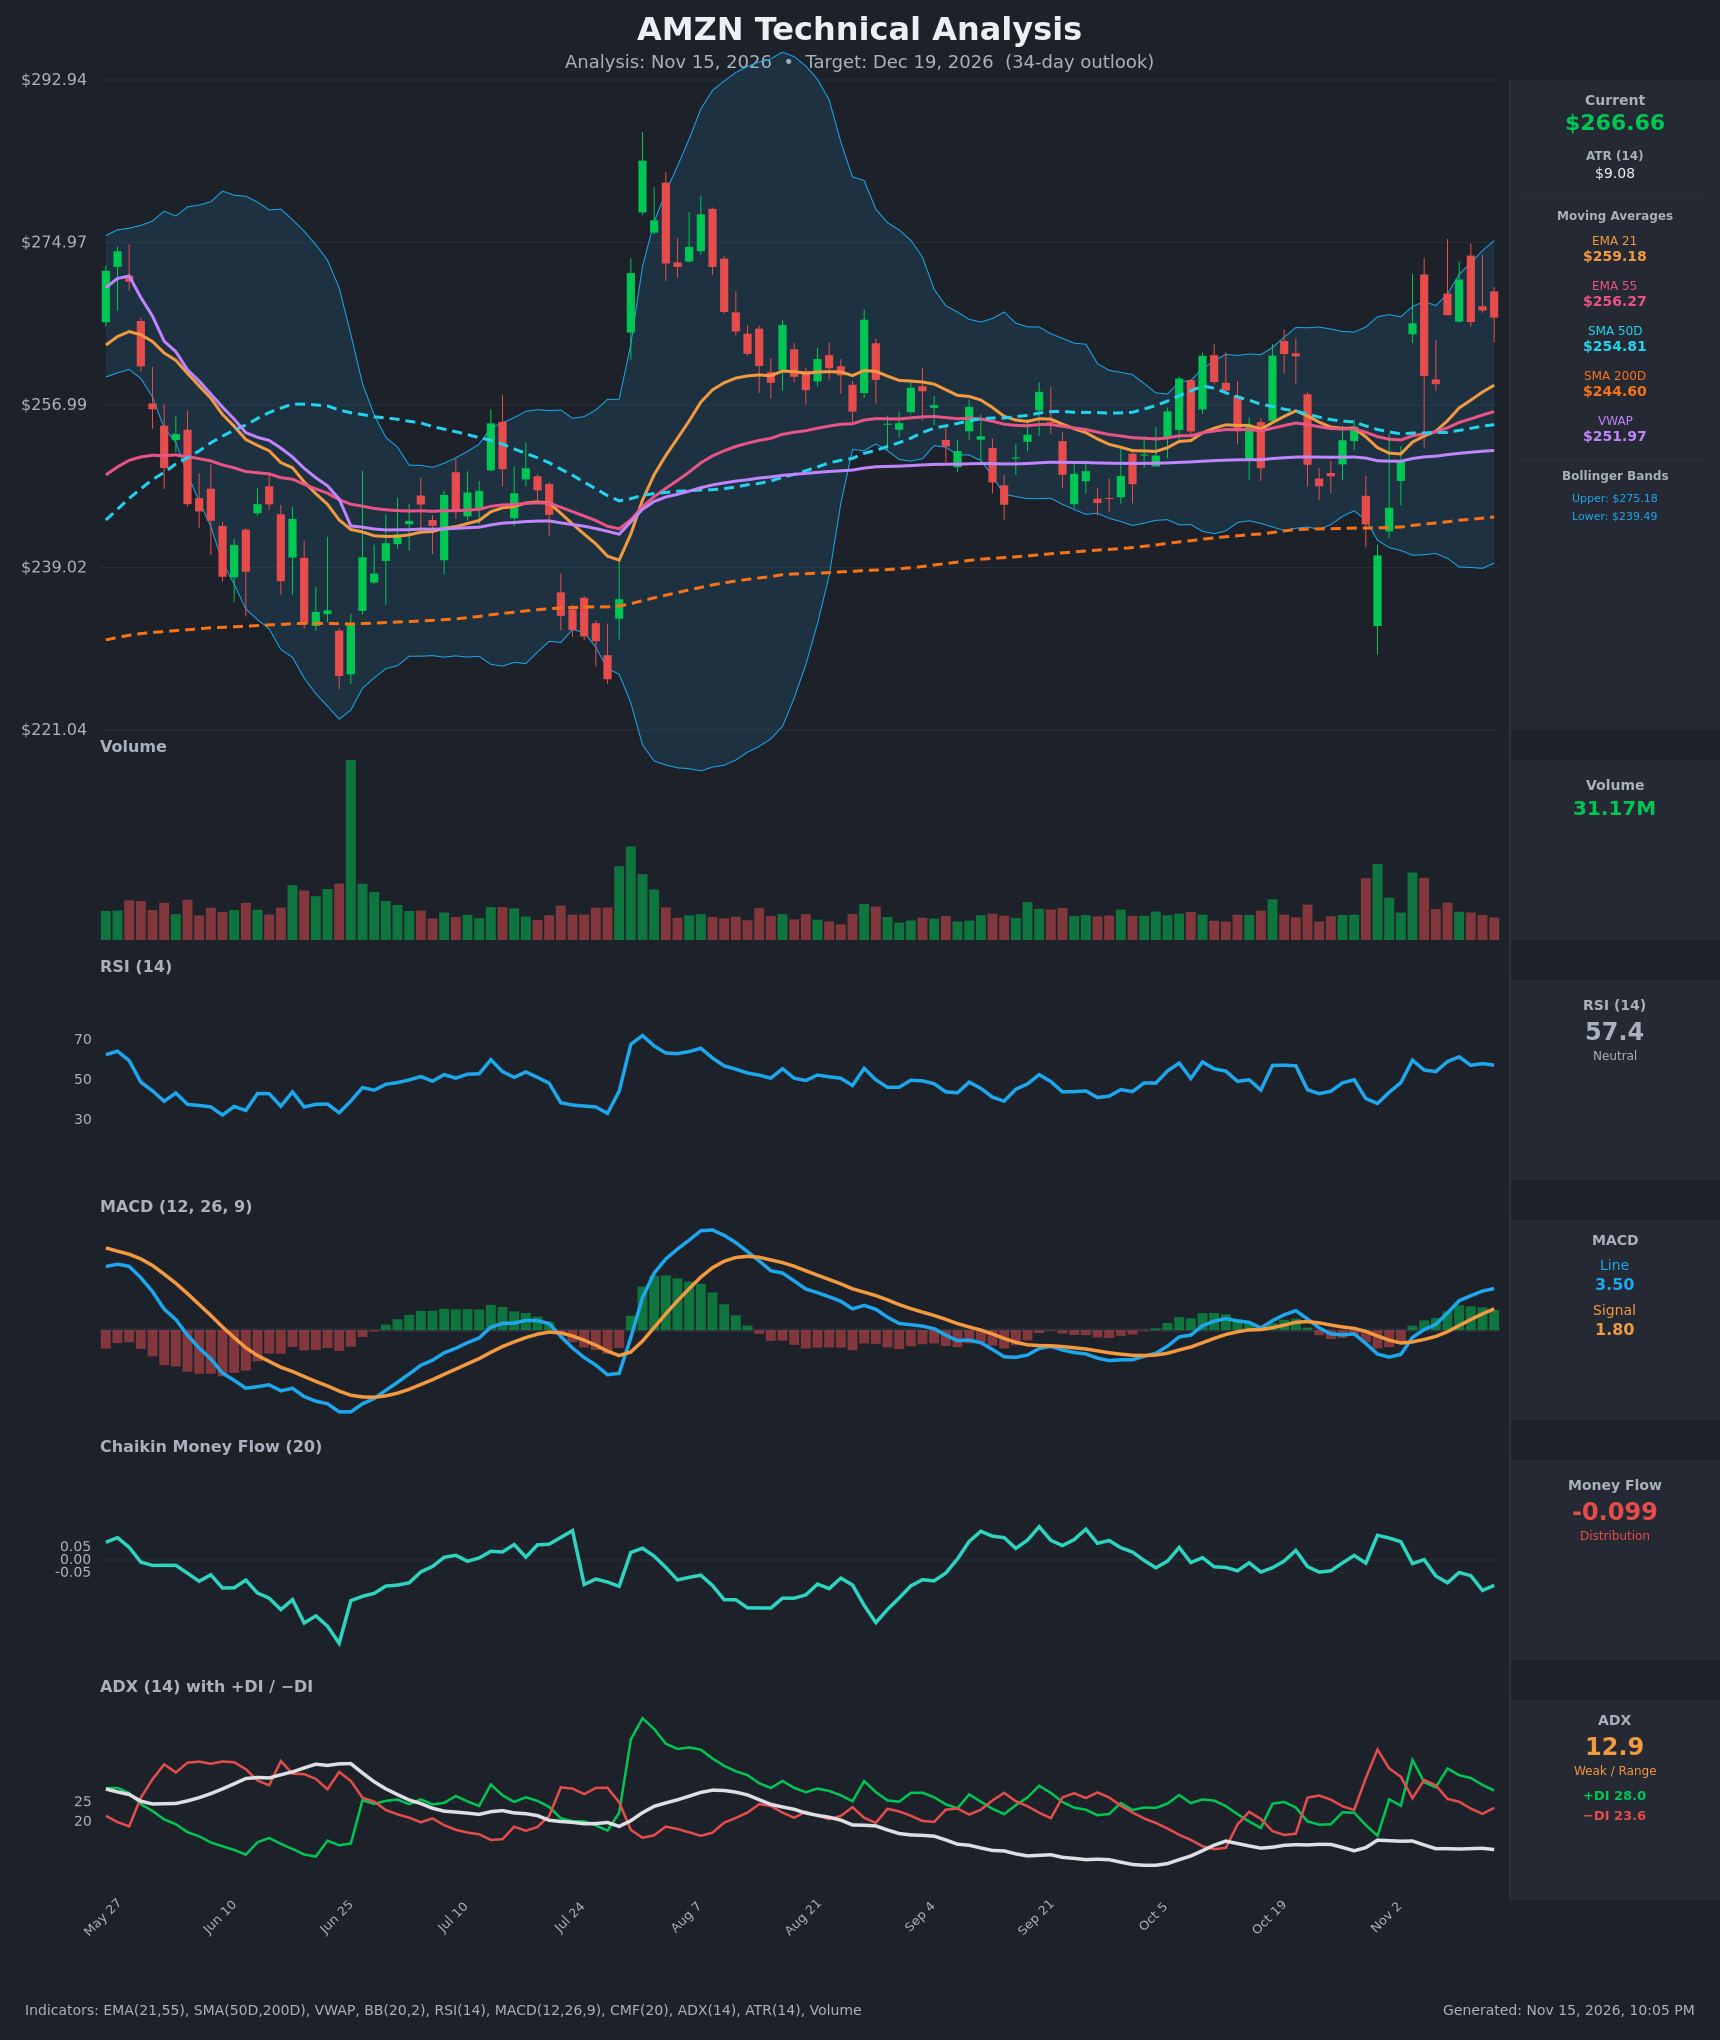
Analysis
TECHNICAL INDICATORS
- RSI (14): 57.43, in the upper half of the neutral zone. It has held between about 54 and 62 over the last week and is well short of overbought (70). Momentum is mildly positive but flattening. [Neutral]
- 20 EMA (EMA 21): $259.18, with price at $266.66 about 2.9% above it. EMA 21 is rising and sits above EMA 55 ($256.27), which is a bullish alignment. The EMA 21 is the first dynamic support. [Bullish]
- MACD: Line 3.50 is above signal 1.80 after a bullish crossover around Nov 5. The histogram is positive at about +1.7 and widening. The line has been rising, but the last bar's gain was smaller (3.29 to 3.50), so momentum growth is slowing. [Bullish]
- Bollinger Bands (20): Upper $275.18, lower $239.49, middle about $257. Price is in the upper half of the bands, about $8.5 below the upper band. The bands are fairly wide after the early-November volatility, so there is room to move either way. Price has already touched the upper band area around $270-$275, and that zone has capped rallies. [Neutral]
- CMF (20): -0.099, below the -0.05 threshold. It has been falling from positive readings in early November, so volume-weighted flows show distribution even as price rises. That is a warning sign for the rally. [Distribution]
- ADX (14): 12.9, well below 20, so there is no real trend and the market is range-bound. +DI (28.0) is above −DI (23.6), a slight bullish tilt, but the gap is narrow and ADX is flat to falling. [Weak Trend + mild bullish bias]
- Volume: 31.17M, modest and in line with recent sessions. The big spikes came on the Oct 29-30 selloff and the Nov 4 rebound. Recent rally bars carry average volume, so there is no strong conviction behind the push to $270. [Neutral / lacks confirmation]
DIVERGENCES & TRENDS
- Price vs. CMF: Price made a higher high near $270.87 on Nov 10 while CMF fell from about +0.09 to -0.10. This is a bearish divergence: price strength is not backed by buying volume.
- Price vs. RSI/MACD: No clear divergence. Both rose with price. RSI peaked at 61.6 on Nov 10 and has not exceeded it, and MACD histogram growth is slowing.
- Moving averages: Price is above all key averages (EMA 21, EMA 55, SMA 50D at $254.81, SMA 200D at $244.60, and VWAP at $251.97). EMA 21 is above EMA 55, and SMA 50D is above SMA 200D (golden cross already in place), so the long-term structure is bullish.
- Crossovers: The MACD bullish crossover around Nov 5 is the most recent. The +DI/−DI crossover back to bullish happened around Nov 4.
- ADX: At 12.9 it signals trendless, choppy conditions, consistent with the multi-month range of roughly $240 to $275.
CHART PATTERNS
- Range / possible Bearish Double Top: Price has stalled at $270-$275 several times (the Aug peak near $285 was higher, but recent highs cluster near $270-$274 on Nov 10 and Nov 13). A retest of that zone with failure would resemble a Bearish Double Top, with the neckline near $250-$253. The measured move from a $273 top to a $252 neckline is about $21, giving roughly $231. That is a stretch for 34 days, so partial follow-through to about $250 is more realistic.
- Base above the 200-day: The $240-$255 area has repeatedly held (SMA 50D, SMA 200D, VWAP), forming a broad consolidation floor. A decisive close above $275 would set up a breakout toward $285-$293 (the Aug high).
- Pattern verdict: The range is mostly sideways and no pattern is confirmed. The tilt is slightly toward a rejection at resistance, given the CMF divergence and ADX weakness.
POTENTIAL SCENARIOS
- Scenario 1: Bearish Rejection at Range Top — The $270-$275 resistance and Bollinger upper band cap the rally. CMF distribution drags price back toward the moving-average cluster. Trigger: daily close below the EMA 21 (~$259) with MACD histogram turning negative. Target: $250-$255 (SMA 50D / EMA 55 / VWAP zone). Invalidation: daily close above $275.50. (45% probability)
- Scenario 2: Bullish Breakout — Price holds above EMA 21, the golden-cross structure keeps buyers engaged, and price pushes through $275 into the Aug high area. Trigger: close above $275.50 on rising volume with CMF turning positive. Target: $283-$290. Invalidation: close below $257. (30% probability)
- Scenario 3: Neutral Range Chop — ADX stays below 20 and price oscillates between about $255 and $273 through mid-December. Trigger: failed breaks on both sides, with price staying above EMA 21. Target: $262-$268. Invalidation: close outside $252-$276. (25% probability)
PRICE TARGETS
For a 34-day horizon, the range width should be about 12-18% of price. The range below is $240.00 to $281.00, a $41.00 width, or about 15.4% of $266.66. The target is $259.50, about 2.7% below current price, reflecting the CMF distribution divergence, the flat ADX, and rejection risk at the upper band. The 34-day ATR-based move is roughly ±$9.08 × √34 ≈ ±$53 at one sigma, so a ±$20 range is a moderate, trend-informed estimate.
- Target Price: $259.50 (34-day)
- Expected Range: $240.00 to $281.00
- Key Levels: Support at $259.18 (EMA 21), with deeper support at $254.81 (SMA 50D); Resistance at $275.18 (Bollinger upper / range top)
OVERALL BIAS
OVERALL BIAS: BEARISH - Price is stalling beneath the $270-$275 resistance and upper Bollinger Band, CMF shows distribution (-0.099) against rising prices, and ADX at 12.9 signals no trend to carry a breakout. The long-term structure remains healthy, so the expected pullback is likely a retest of the $255-$259 moving-average cluster rather than a breakdown.
This is educational analysis and not financial advice.