AMZN 20-day bullish forecast — Nov 15, 2026
- Bias: Bullish
- Timeframe: 20 days (made Nov 15, 2026, target date Dec 4, 2026)
- Price at analysis: $266.66
- Price target: $273.00
- Expected range: $255.00 – $283.00
- Result: Pending — graded after the close on Dec 4, 2026
Get a free AI analysis of AMZN today
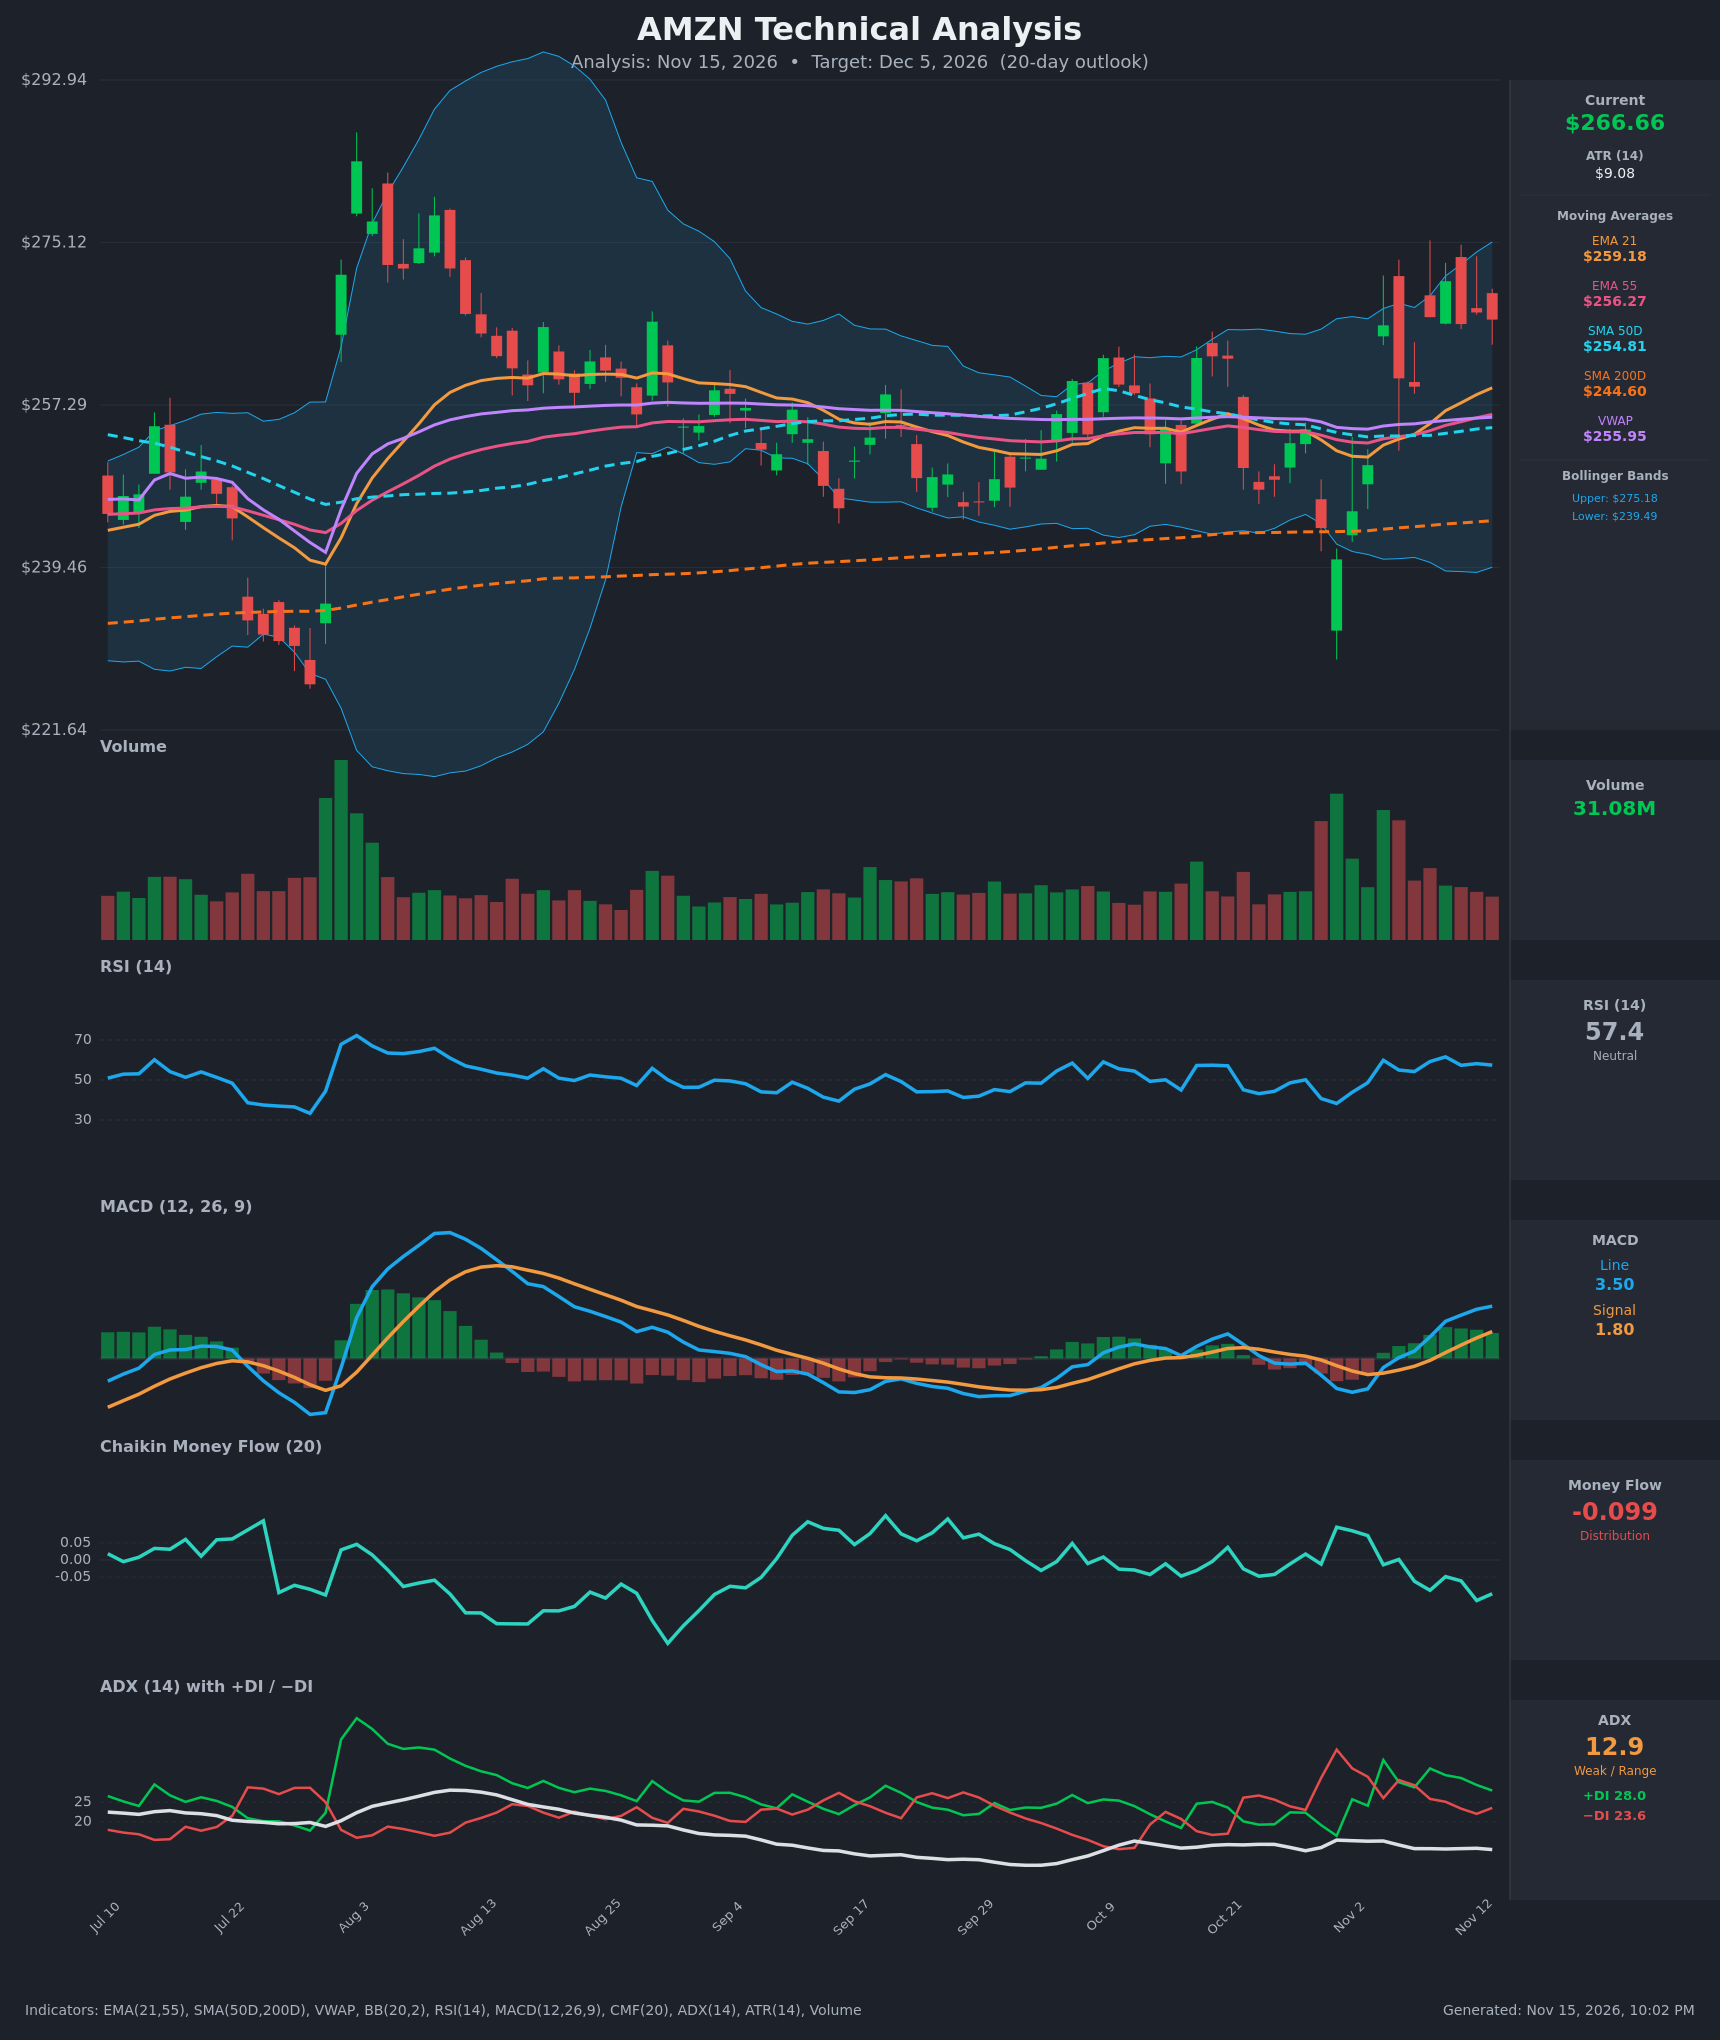
Analysis
TECHNICAL INDICATORS
- RSI (14): 57.4, in the neutral upper half. It has held between 54 and 62 since the Nov 4 surge, so momentum is steady rather than accelerating. There is about 12 points of room before overbought. [Bullish]
- 20 EMA: The 21 EMA is $259.18 and rising, with price about 2.9% above it. EMA21 has been above EMA55 ($256.27) since about Nov 6, so the short-term trend is up and the EMA acts as dynamic support. [Bullish]
- MACD: The line is 3.50 and the signal 1.80, both above zero. The line crossed above the signal around Nov 5 and the spread has widened for eight sessions, so the histogram is positive and expanding. [Bullish]
- Bollinger Bands (20): Upper is $275.18, lower $239.49 and the midline about $257.3. Price is in the upper third of the bands. The bands are narrowing after the volatile Aug expansion, and the Nov 10 and Nov 12 wicks stalled near the upper band. Price can walk the band higher, but $275 is a hurdle. [Neutral]
- CMF (20): -0.099, in distribution territory (below -0.05) and falling from +0.09 on Oct 30. Price made higher highs while money flow turned negative, so buying conviction is lacking. [Distribution]
- ADX (14): 12.9, a very weak trend and range-like conditions. +DI (28.0) is above −DI (23.6), so bulls hold a slight edge. The +DI/−DI gap has narrowed from 33.6/25.8 on Nov 9. [Weak Trend, slight bullish lean]
- Volume: 31.08M, a below-average, declining profile on the recent push toward $270. The heavy-volume bars were the Oct 30 to Nov 4 selloff and rebound. Recent advances lack volume confirmation. [Neutral to mildly Bearish]
DIVERGENCES & TRENDS
- Bearish divergence: Price is making higher highs ($266 → $270.87 → $267) while CMF falls from positive to -0.099. Volume is also fading on the rally.
- Trend structure: Price sits above EMA21, EMA55, SMA50D ($254.81), VWAP ($255.95) and SMA200D ($244.60). The stack is EMA21 > EMA55 > SMA50D > SMA200D, a clean bullish alignment. SMA50D has been above SMA200D for a long time, so there is no death-cross risk.
- Crossovers: The MACD bullish crossover on Nov 5 is still intact and widening. The +DI/−DI crossover flipped bullish on Nov 4, but the ADX of 12.9 means it carries little weight.
- Higher lows: The swing lows rose from about $240 (Oct 30) to $245.6 and then $259, which shows buyers defending dips.
- RSI: It is flat around 57, with no overbought reading and no divergence.
CHART PATTERNS
- Ascending triangle / rectangle (continuation, bullish lean): Resistance is flat at about $270–275, with rising lows from the Oct 30 capitulation low. A confirmed close above about $275 would project a measured move of roughly $16 (the pattern height), toward $290. That is beyond the 20-day horizon, though the Aug high near $285 is a visible overhead zone.
- Possible double top (bearish caveat): The Nov 10 and Nov 12 highs near $270–275 look like a minor double top, supported by the CMF distribution and light volume. A break below the $259 EMA21 and then $255 would activate it, with a target near $245.
- The pattern is not yet decisive, since the ADX is very low. The bullish MA structure tips the balance modestly toward the ascending-triangle reading.
POTENTIAL SCENARIOS
- Scenario 1: Bullish Breakout Above Resistance — Price holds the EMA21 and the rising lows, then breaks through the $270–275 supply zone as the MACD continues to widen. Trigger: daily close above $275.18 (the upper Bollinger Band) with improving volume. Target: $280–$285 (the Aug high zone), with $273 as the base case at the 20-day mark. Invalidation: daily close below $255.95 (VWAP/EMA55 cluster). (45% probability)
- Scenario 2: Neutral Range Consolidation — With the ADX at 12.9 and CMF negative, price chops between $257 and $275 and ends the period near the current level. Trigger: repeated failures at $270–275 with support at the EMA21. Target: $260–$270. Invalidation: close above $276 or below $254. (30% probability)
- Scenario 3: Bearish Double-Top Rollover — CMF distribution proves right, price loses the EMA21 and fills the Nov 4 gap area. Trigger: close below $259.18 on rising volume with MACD histogram turning negative. Target: $245–$250 (SMA200D at $244.60 is the deeper support). Invalidation: reclaim of $266 on strong volume. (25% probability)
PRICE TARGETS
- Target Price: $273.00 (20 trading days, about Dec 5, 2026)
- Expected Range: $255.00 to $283.00 (width $28, about 10.5% of the current price, consistent with the 14–21 day guidance)
- Key Levels: Support at $259.18 (EMA21, with $255.95–$256.27 VWAP/EMA55 as the secondary floor), Resistance at $275.18 (upper Bollinger Band and recent highs)
OVERALL BIAS
OVERALL BIAS: BULLISH - Price is above every key moving average in a clean bullish stack, the MACD is positive and widening, and the swing lows are rising, so a grind toward $273 is the most probable outcome. The CMF distribution and weak ADX limit conviction and argue for a modest target below the $275 resistance.
This is educational analysis and not financial advice.