AMZN 48-day bullish forecast — Nov 15, 2026
- Bias: Bullish
- Timeframe: 48 days (made Nov 15, 2026, target date Jan 1, 2027)
- Price at analysis: $266.66
- Price target: $277.00
- Expected range: $255.00 – $295.00
- Result: Pending — graded after the close on Jan 1, 2027
Get a free AI analysis of AMZN today
Analysis
TECHNICAL INDICATORS
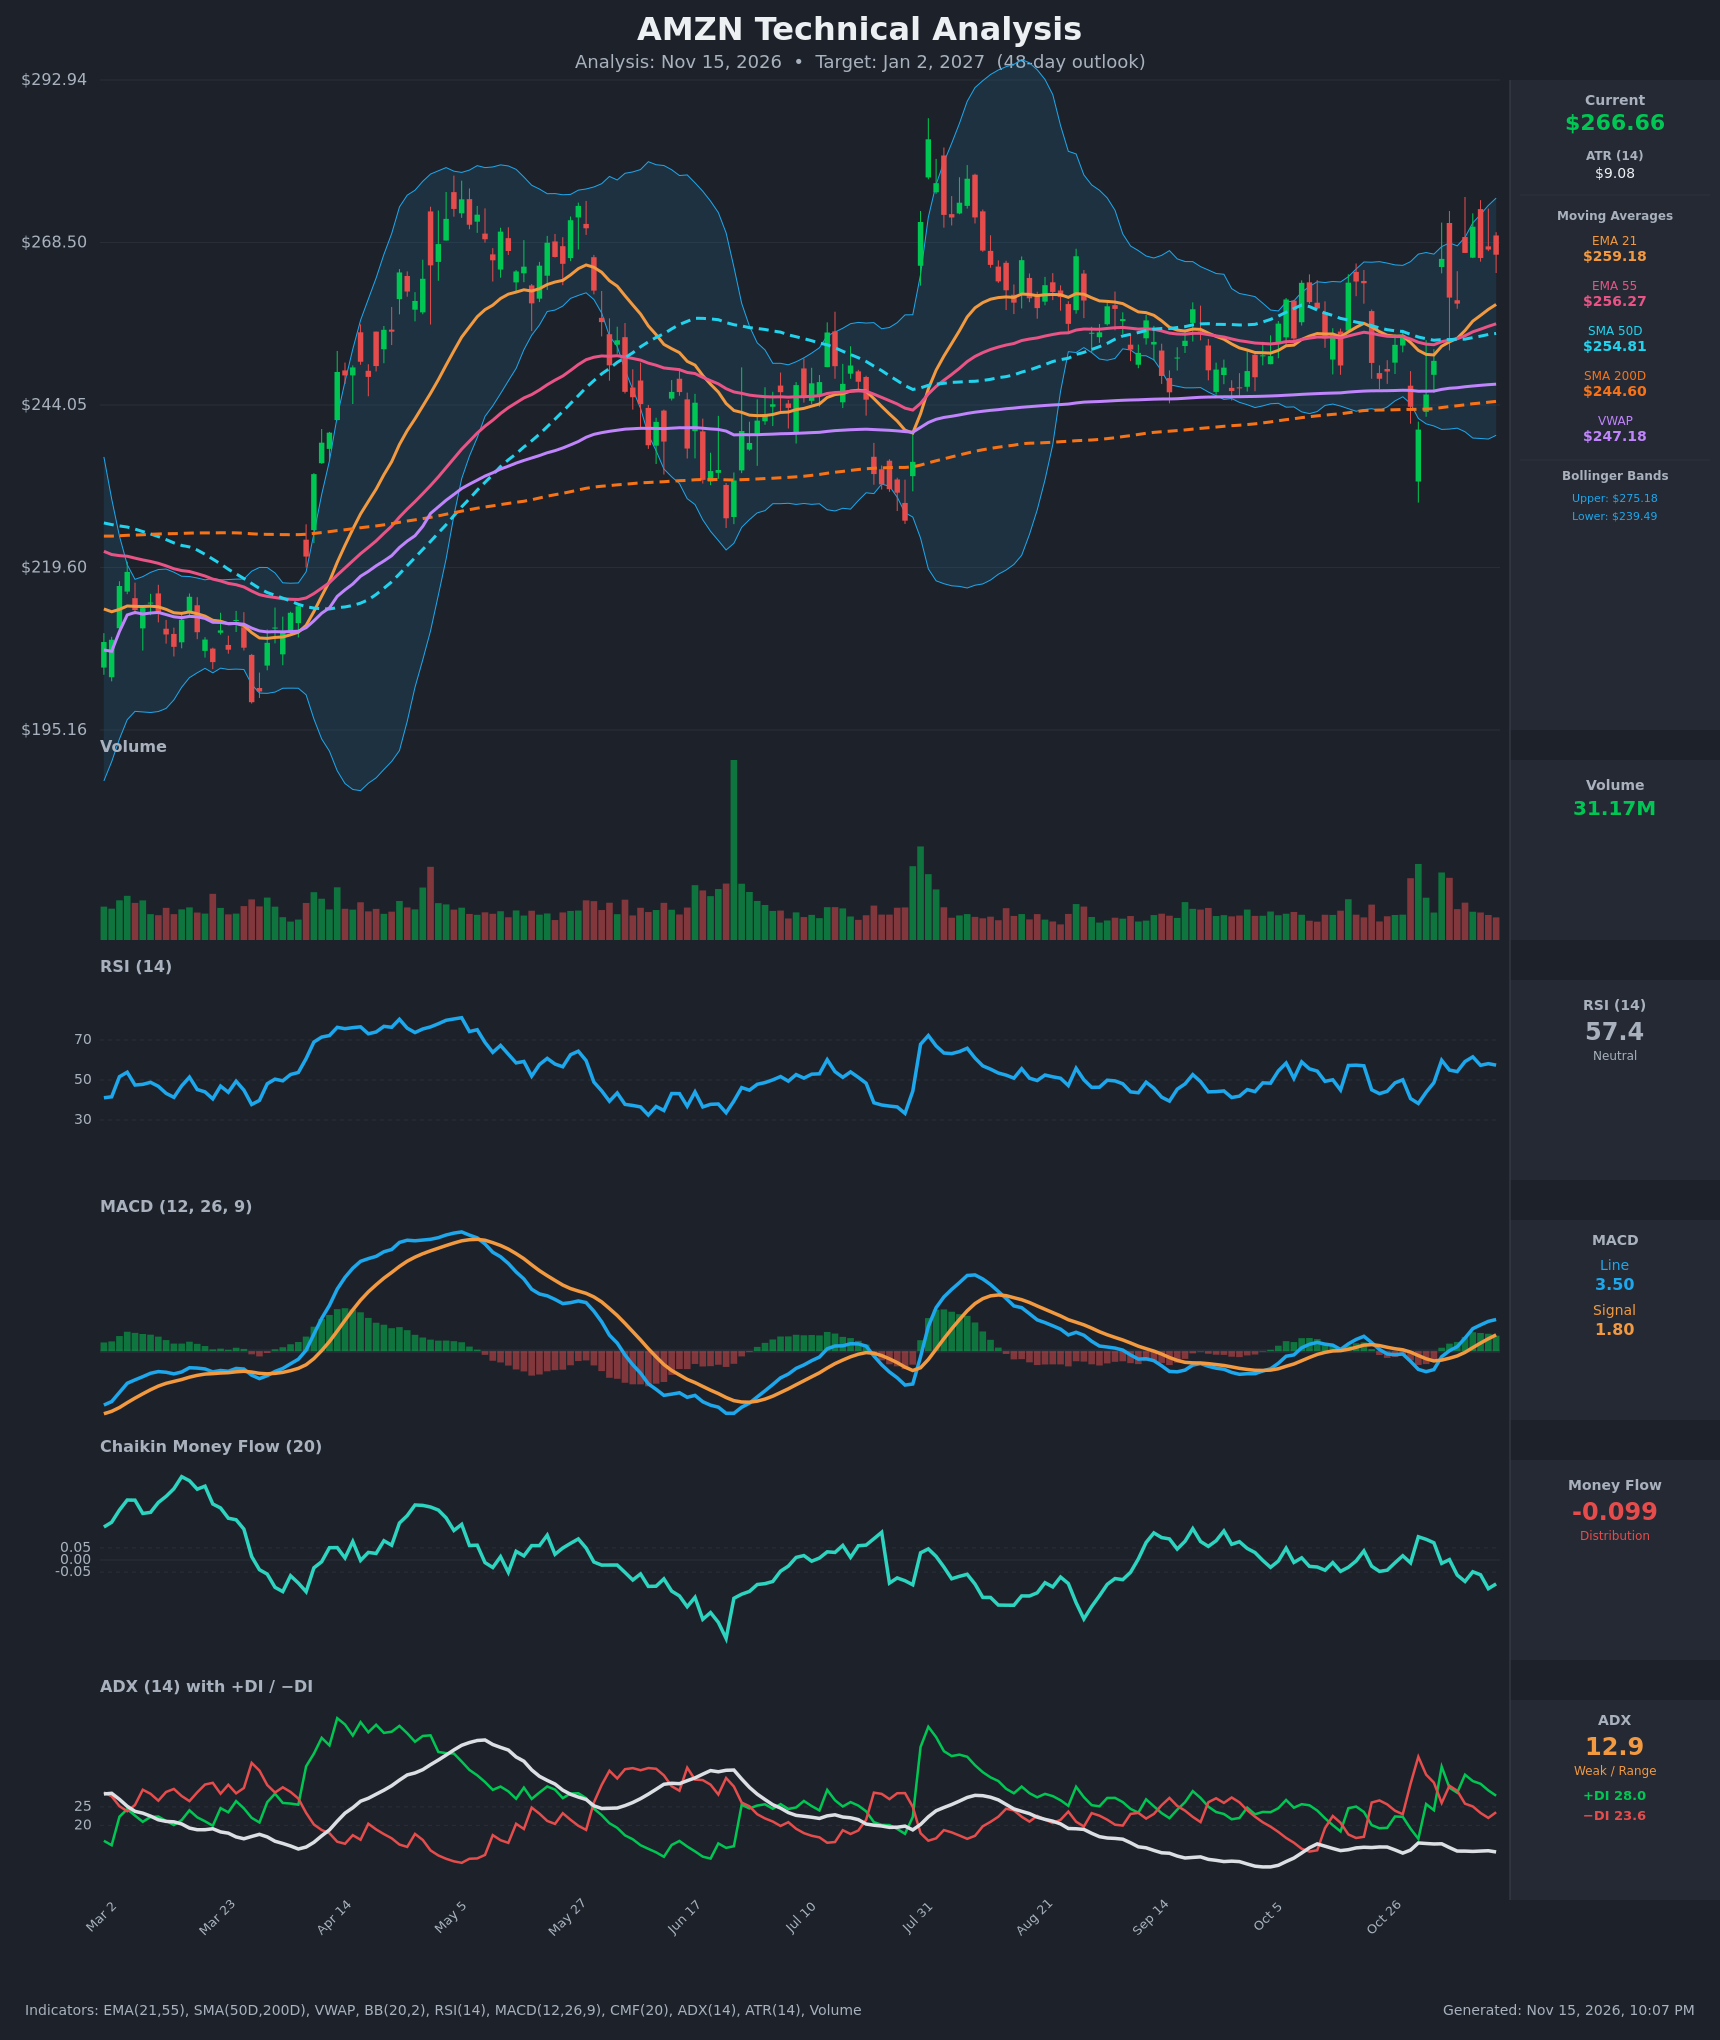
- RSI (14): 57.4, in the neutral middle zone with room before 70. It has held 54-62 since the Nov 4 gap-up, which is steady momentum without an overbought reading. [Bullish]
- 20 EMA (EMA 21): $259.18, with price about 2.9% above it. The EMA is rising, and EMA21 ($259.18) is above EMA55 ($256.27), so it acts as dynamic support. The nearest pullback zones are $259 and $255-256. [Bullish]
- MACD: Line 3.50 is above signal 1.80. It crossed up around Nov 5 and the histogram has widened for several sessions. The line is still near the zero-line zone and well below the July and April peaks, so there is room to run. [Bullish]
- Bollinger Bands (20): Upper $275.18, lower $239.49, midline about $257. Price sits in the upper half, about $8.50 below the upper band. The bands are moderately wide after the October dip, and price is pressing the upper half of the range without a band-walk. [Bullish]
- CMF (20): -0.099, below the -0.05 threshold and trending down since early November. Price has made higher highs while money flow made lower highs, so rallies lack buying support. [Distribution]
- ADX (14): 12.9, well below 20 and near its lows for the year, so there is no established trend. +DI (28.0) is above -DI (23.6), a mild bullish tilt, but the spread has narrowed from Nov 9-10. [Weak Trend, slight bullish lean]
- Volume: 31.17M, around average. Volume spiked on the Oct 29-30 selloff and the Nov 4 gap-up, but the push to $270 had no expansion. Participation is not confirming a breakout yet. [Neutral to mildly cautious]
DIVERGENCES & TRENDS
- Bearish CMF divergence: Price is at its highest since early August while CMF sits near its recent low (-0.099 against positive readings in early November). This is the main warning flag.
- MA structure is fully bullish: Price ($266.66) > EMA21 > EMA55 > SMA50D ($254.81) > SMA200D ($244.60) > VWAP ($247.18). The 50D is above the 200D, so the golden cross is already in place.
- Crossovers: The MACD bullish cross (about Nov 5) is confirmed. Price reclaimed EMA21/EMA55 on Nov 4. +DI crossed back above -DI on Nov 4 and has held.
- ADX is the limiting factor: At 12.9, breakouts often fail or chop. The trend is not yet confirmed.
- Trend: Since August the stock has made a series of higher lows (about $240 in October, against about $225 in July). It remains capped near $270-273.
CHART PATTERNS
- Ascending Triangle (continuation, reference diagram): Since August, price has met flat resistance around $270-273 while lows have risen, with higher lows from the October $240 flush through the MAs. A close above $273 would trigger the pattern. The measured move (range height of about $28 added to the breakout) gives roughly $295-300 in the best case.
- Broad range context: The $240-$273 band has held for about 3.5 months, so a failed breakout back into the range is a real risk given ADX of 12.9 and negative CMF.
- Secondary: The Nov 4 gap-up with higher-low consolidation resembles a mild bullish flag or base on the daily chart.
POTENTIAL SCENARIOS
- Scenario 1: Bullish Breakout From Ascending Triangle — Price clears $273 on improving volume. Moving averages keep rising and MACD extends above zero, pulling in momentum buyers. Trigger: daily close above $273 with volume above 35M. Target: $277-$285 within 48 days, with an extension toward $295 if CMF turns positive. Invalidation: close below $255 (the SMA50D / EMA55 zone). (50% probability)
- Scenario 2: Neutral Range Persistence — The CMF distribution caps rallies below $273, and price oscillates between $255 and $273 with weak ADX. Trigger: repeated rejections at $270-275 and the upper Bollinger Band. Target: $258-$270. Invalidation: a decisive close outside $253-$275. (28% probability)
- Scenario 3: Bearish Failed Breakout — Distribution wins, price loses EMA21 and the SMA50D, and the stock slides back to the lower Bollinger Band area. Trigger: close below $254.80 with a MACD bearish cross. Target: $244-$248 (SMA200D / VWAP), with $240 as a worst case. Invalidation: reclaim of $266 on volume. (22% probability)
PRICE TARGETS
- Target Price: $277.00 (48 days, Jan 2, 2027)
- Expected Range: $255.00 to $295.00. The width is $40, which is 15.0% of the current price and fits the 30-60 day guidance of 12-18%.
- Key Levels: Support at $259.18 (EMA21; next $254.81 SMA50D), Resistance at $273.00 (recent swing highs; next $275.18 upper Bollinger Band)
OVERALL BIAS
OVERALL BIAS: BULLISH - The moving averages are fully stacked bullish, MACD has crossed up, and the stock is pressing the top of an ascending-triangle range with higher lows. The negative CMF and weak ADX (12.9) temper conviction, so the upside target is modest at $277.
This is educational analysis and not financial advice.