AMZN 27-day bullish forecast — Nov 15, 2026
- Bias: Bullish
- Timeframe: 27 days (made Nov 15, 2026, target date Dec 11, 2026)
- Price at analysis: $266.66
- Price target: $272.00
- Expected range: $251.00 – $283.00
- Result: Pending — graded after the close on Dec 11, 2026
Get a free AI analysis of AMZN today
Analysis
TECHNICAL INDICATORS
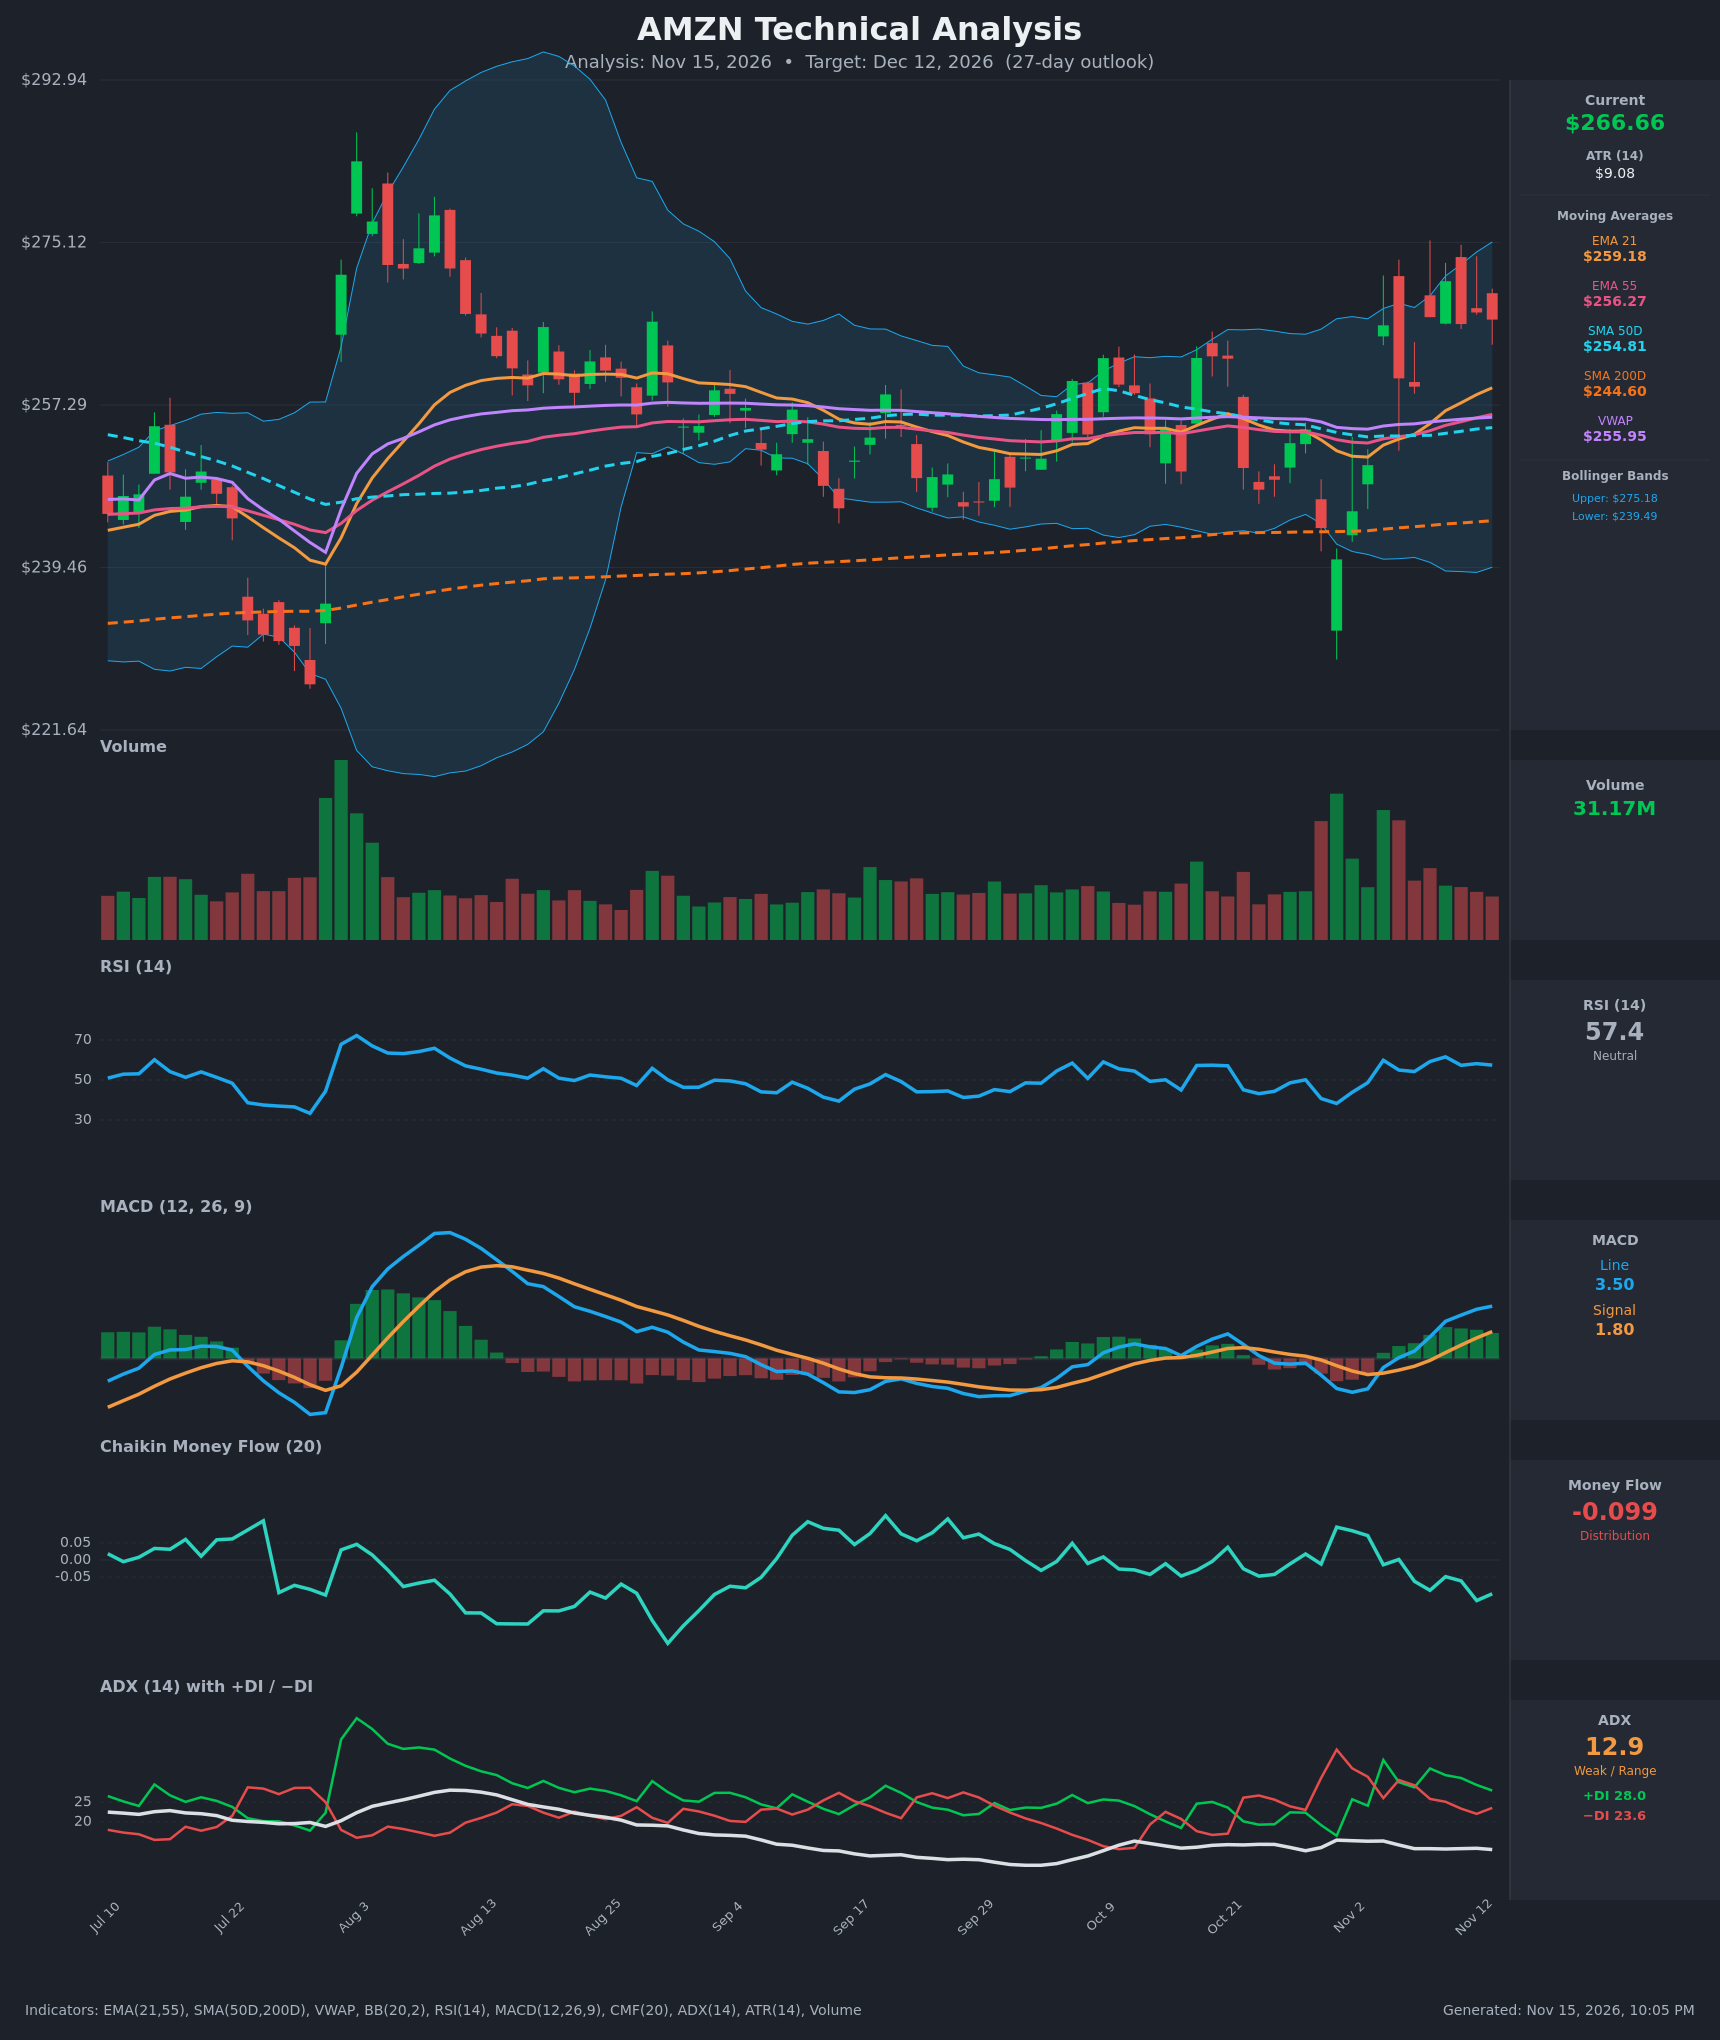
- RSI (14): 57.43, in the neutral-to-firm zone. It has recovered from 38 on Oct 30 and has held between 54 and 62 since Nov 4. There is room before overbought (70) and momentum is mildly positive but flat. [Bullish]
- 20 EMA: The data gives EMA 21 at $259.18, with price at $266.66 about 2.9% above it. EMA21 is rising and sits above EMA55 ($256.27), SMA50D ($254.81) and SMA200D ($244.60), a fully stacked bullish order. EMA21 is the first dynamic support. [Bullish]
- MACD: The line is 3.50 against a signal of 1.80, so the histogram is +1.70 and widening. The bullish crossover came on Nov 5, and both lines are now above zero. This is the strongest bullish evidence on the chart. [Bullish]
- Bollinger Bands (20): The upper band is $275.18, the lower $239.49 and the midline about $257.3. Price sits at roughly 76% of the band width, in the upper half but not at the band. The upper band is also where recent highs (about $273-275) were rejected. The bands have been fairly flat, which fits a range. [Neutral]
- CMF (20): -0.099 is below the -0.05 threshold. It has fallen from about +0.09 in early November while price rose, so rallies are not backed by real buying. This is the main warning sign. [Distribution]
- ADX (14): 12.9 is very weak and falling, so there is no established trend and the market is range-bound. +DI (28.0) is above -DI (23.6), so the slight directional edge is bullish. The gap has narrowed from about 11 points on Nov 9 to 4.4. [Weak Trend + mildly bullish]
- Volume: 31.17M is below the heavy spike days at the Oct 30 gap-down and Nov 4 reversal. The Nov 10-13 advance came on average-to-light volume with small-bodied candles and upper wicks. That is not convincing breakout participation. [Neutral / lacking confirmation]
DIVERGENCES & TRENDS
- CMF divergence: Price made higher highs from Nov 4 to Nov 10-12 ($266 → $271), but CMF fell from +0.09 to -0.10. This is a bearish divergence, with price rising on weak money flow.
- ADX/DI: ADX is below 13 and has drifted lower since August. +DI is above -DI, but the spread is shrinking, so bullish control is tentative.
- MACD: It crossed above the signal on Nov 5 and the histogram is rising. Momentum is clearly improving, but the MACD line is still below the late-July peak.
- Moving averages: SMA50D ($254.81) is above SMA200D ($244.60), so the golden-cross structure is intact. Price is above the 200-day, which confirms the long-term uptrend. EMA21 crossed above EMA55 around Nov 6.
- VWAP: Price ($266.66) is about 4.2% above VWAP ($255.95), which shows buyers in control recently. VWAP, EMA55, SMA50D and the EMA21 cluster around $255-259, a strong support zone.
- Range: Since August, price has been oscillating roughly between $240 and $275, and the $270-275 zone has capped rallies several times.
CHART PATTERNS
- Possible Bearish Double Top (Reversal): Highs near $271-275 on Nov 10-13 are forming a potential double top, with a neckline near $259-260 (the Nov 5-6 lows and the EMA21 area). A close below that level would target roughly $245-247 (a measured move of about $13-15). CMF weakness supports this risk.
- Ascending Triangle / bullish range-breakout setup (Continuation): Higher lows ($240.35 → $245.63 → $250.69 → $259.30) against flat resistance around $271-275 resemble an ascending triangle. A decisive close above $275 would target about $290-295 (the $35 height of the Oct 30 low to resistance, measured from the breakout). The pattern is only loosely formed, and weak ADX reduces its reliability.
- Overall: The broader structure is a wide consolidation, with the near-term pattern leaning slightly bullish because of the higher lows and MACD.
POTENTIAL SCENARIOS
- Scenario 1: Bullish Breakout Above Range Resistance — Higher lows, the MACD crossover and the stacked MAs push price through the $271-275 supply zone and the upper Bollinger Band. Trigger: daily close above $275.20 on improving volume and CMF turning back above 0. Target: $280-285, with an extension to about $290. Invalidation: close below $259 (EMA21). (45% probability)
- Scenario 2: Neutral Range-Bound Chop — With ADX near 13, price keeps oscillating between the EMA21/SMA50 support cluster and $275 resistance. Trigger: repeated rejections at $270-275 and bounces at $257-260. Target: $258-272. Invalidation: close outside $255-$276. (30% probability)
- Scenario 3: Bearish Double-Top Rejection — Negative CMF divergence leads to a failure at resistance, then a break of the neckline and the moving-average cluster. Trigger: daily close below $259 with MACD histogram rolling over. Target: $247-250, with a deeper test of $240 (lower Bollinger Band) if $254 fails. Invalidation: reclaim of $270. (25% probability)
PRICE TARGETS
Range width check: $283.00 − $251.00 = $32.00, which is 12.0% of $266.66. That is in line with the 27-day horizon, between the 14-21 day and 30-60 day guidance, and much wider than a 2-3 day range.
- Target Price: $272.00 (27-day, modestly above current price)
- Expected Range: $251.00 to $283.00
- Key Levels: Support at $259.18, Resistance at $275.18
OVERALL BIAS
OVERALL BIAS: BULLISH - Price is above all key moving averages (golden-cross structure intact) with a rising MACD histogram, +DI above -DI, and higher lows since Oct 30. Conviction is modest because of negative CMF (-0.099), very weak ADX (12.9), and overhead resistance at $270-275.
This is educational analysis and not financial advice.