AMZN 62-day bullish forecast — Nov 15, 2026
- Bias: Bullish
- Timeframe: 62 days (made Nov 15, 2026, target date Jan 15, 2027)
- Price at analysis: $266.66
- Price target: $277.00
- Expected range: $246.00 – $304.00
- Result: Pending — graded after the close on Jan 15, 2027
Get a free AI analysis of AMZN today
Analysis
TECHNICAL INDICATORS
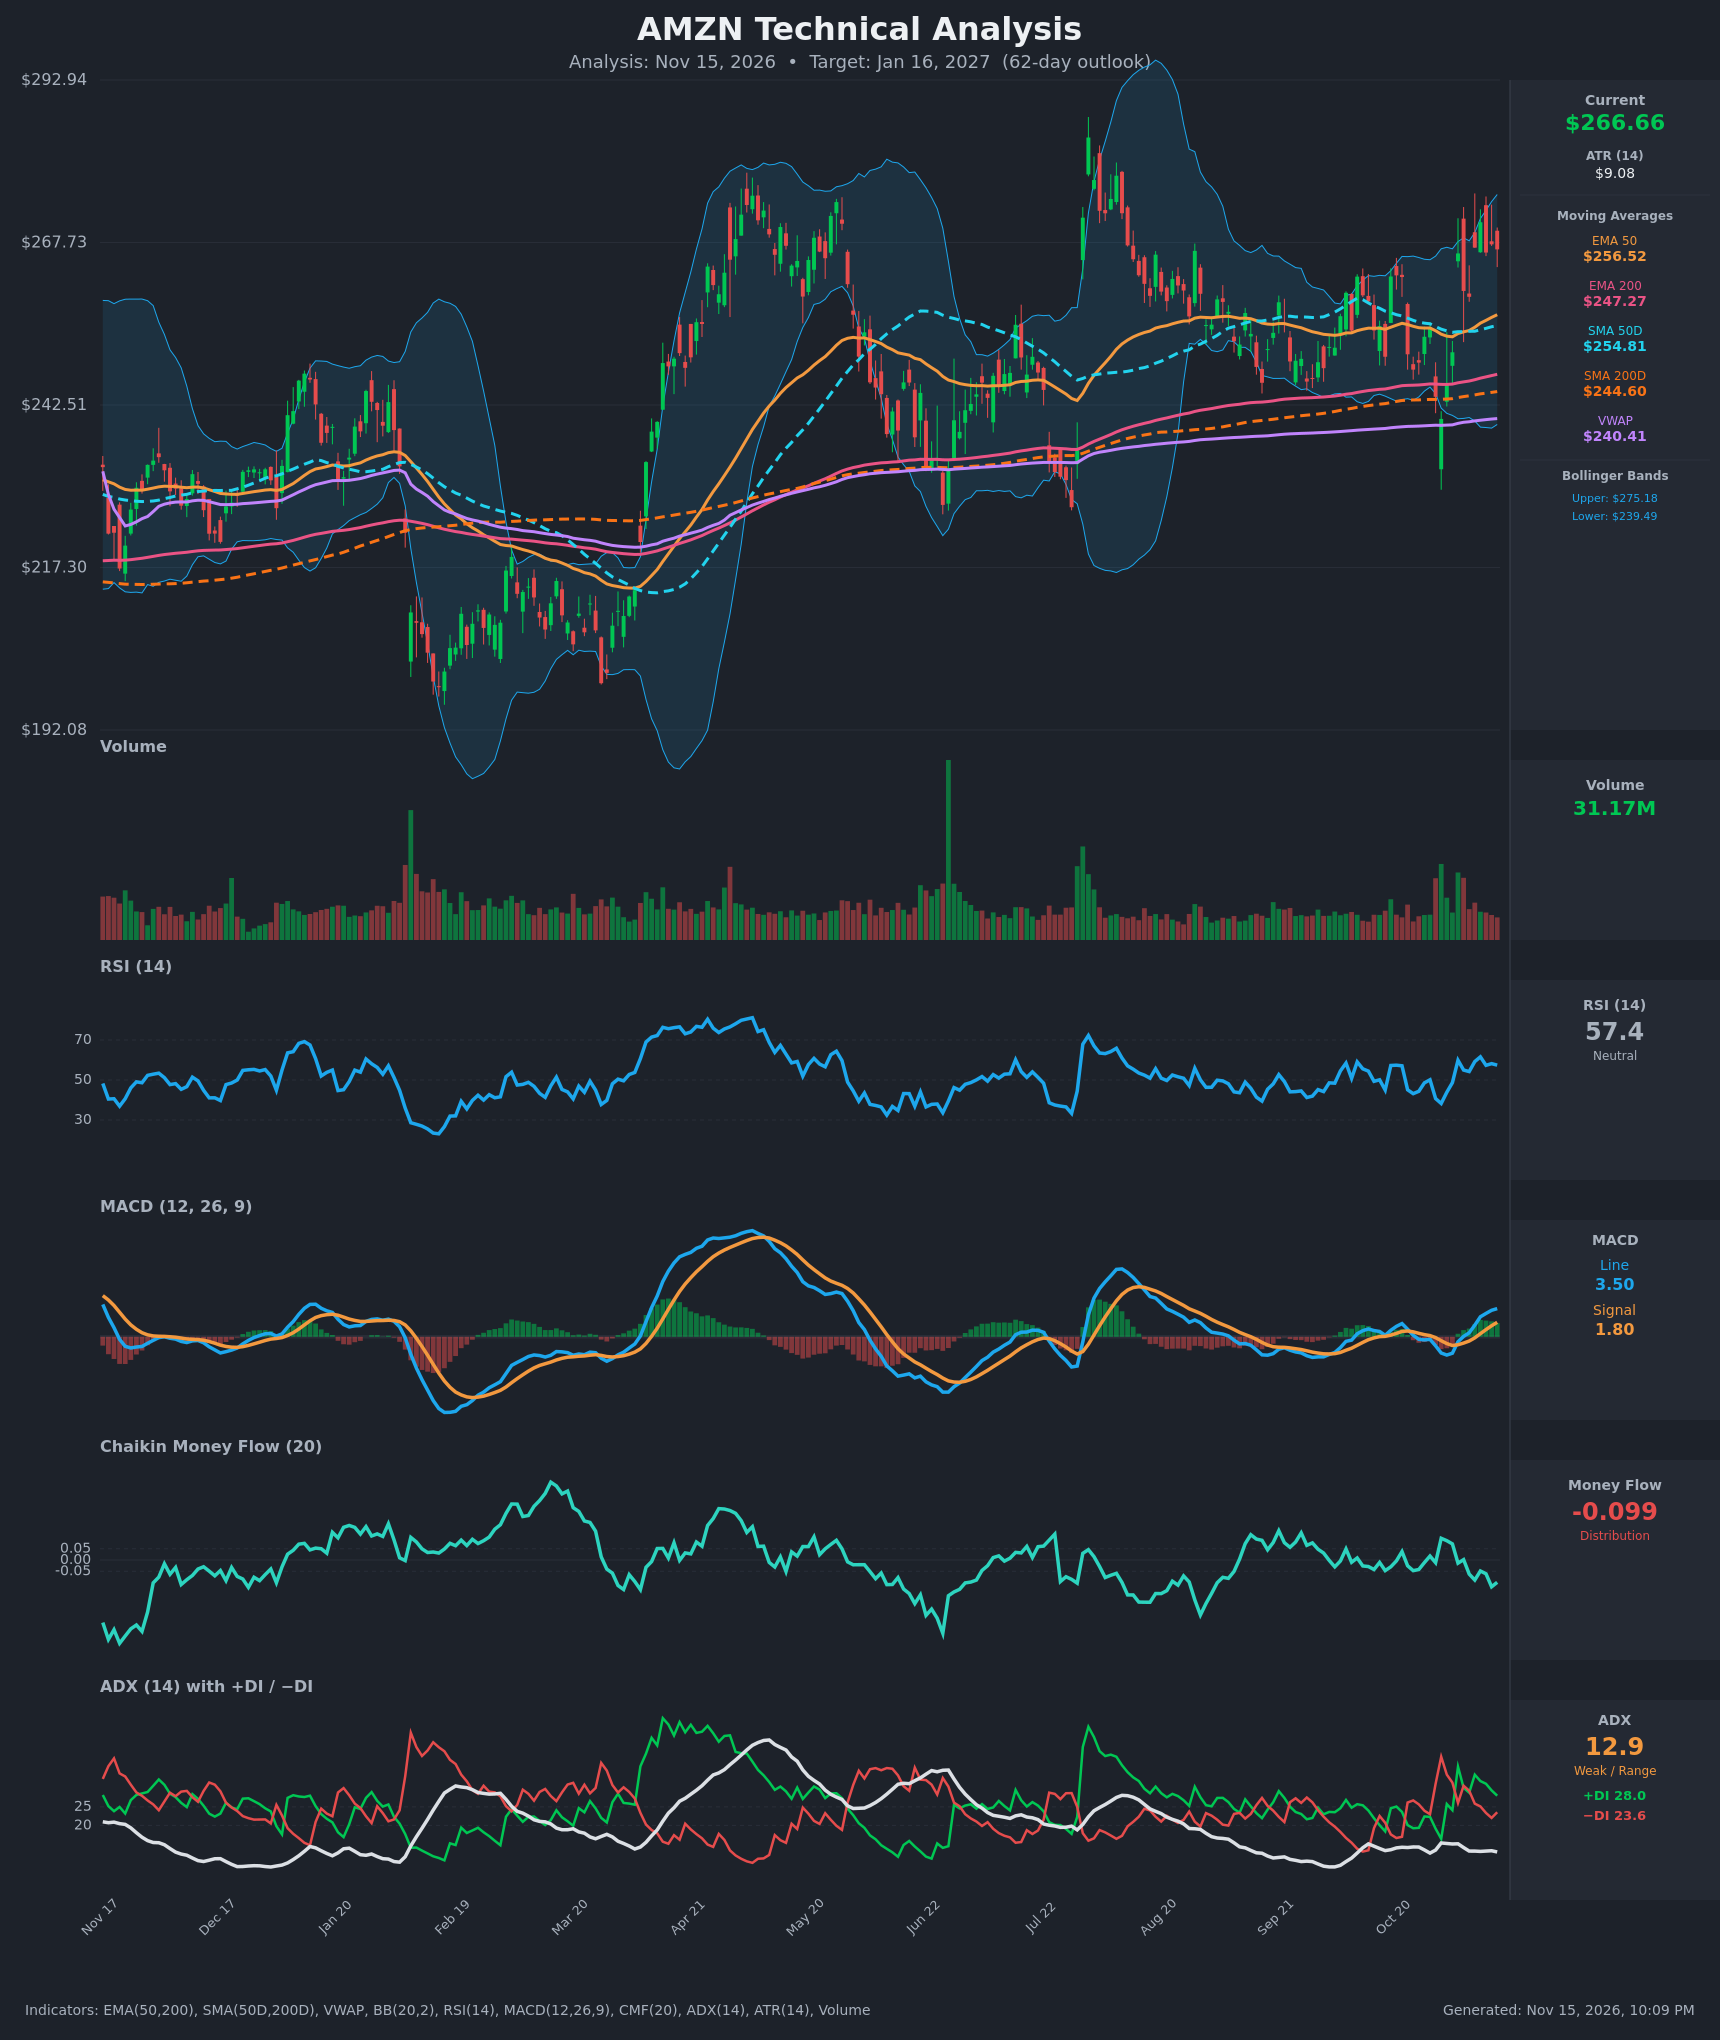
- RSI (14): 57.4, in the middle of the range, up from the 38-40 low on Oct 30. It is not overbought, with room to run toward 70 before momentum is stretched. [Bullish]
- 20 EMA: No 20 EMA value was provided. The EMA 50 at $256.52 is rising and sits about 3.9% below price, and price has held above it since early November. [Bullish]
- MACD: Line 3.50 is above Signal 1.80 with a positive, widening histogram. The bullish crossover happened around Nov 5-9 and the line is accelerating, though it is still far below the April and July peaks. [Bullish]
- Bollinger Bands (20): Upper $275.18, lower $239.49, so the mid-band is about $257. Price at $266.66 is in the upper half, about $8.50 below the upper band. The bands are moderately wide after the late-Oct/early-Nov swings. There is room to test the upper band, which also marks the top of the multi-month range. [Bullish]
- CMF (20): -0.099 is below -0.05 and has been negative since Nov 9 despite higher prices. Buying pressure is not confirming the rally. [Distribution]
- ADX (14): 12.9 is well below 20, so the market is range-bound with no established trend. +DI at 28.0 is above −DI at 23.6, a mild bullish lean, and the spread has narrowed from 35.8/26.0 on Nov 4. [Weak Trend, bullish lean]
- Volume: 31.17M is moderate and below the spikes seen on the late-Oct/early-Nov swings. The Nov 4 jump from $250 to $266 came with a volume surge, which supports that breakout, but participation has faded since. [Neutral to mildly supportive]
DIVERGENCES & TRENDS
- Bearish CMF divergence: Price made higher highs ($266 to $270.87) while CMF fell from about +0.09 to -0.099. This is a warning that rallies are being sold into.
- MA structure: EMA50 ($256.52) is above EMA200 ($247.27), SMA50D ($254.81) is above SMA200D ($244.60), and price is above all of them. The golden cross is already in place and the averages are rising, a firm long-term uptrend backdrop.
- VWAP: Price is about 11% above VWAP ($240.41), showing buyers are in control on a longer basis.
- MACD and RSI: Both turned up from the Oct 30 lows. MACD crossed above its signal on the way, and RSI reclaimed 50 on Oct 28 and Nov 3 and now holds in the mid-to-high 50s.
- DI and ADX: −DI dominated on Oct 29-Nov 3, then +DI took over after Nov 4. ADX is still very low, so this is a drift, not a trend.
- Range context: Since August, price has oscillated between about $240 and $272, with the $270-275 zone repeatedly capping rallies.
CHART PATTERNS
- Ascending Triangle (tentative, continuation): Highs are flat near $270-273 and lows are rising, from the Oct 30 dip toward the rising EMA50 and SMA50D. A close above about $273-275 would target roughly $290-295 (the triangle height of about $30 added to the breakout), which lines up with the July high near $292.
- Bearish Double Top (risk): The $270.87 high on Nov 10 and the earlier peaks near $272 could form a double-top-style cap. A close below the $250-256 area (EMA50/SMA50D) would activate this pattern, with a measured target near $240, the lower Bollinger Band and VWAP zone.
- Overall: The pattern read is a long consolidation with a slight upward bias. A confirmed breakout is needed, and ADX at 12.9 shows no trend yet.
POTENTIAL SCENARIOS
- Scenario 1: Bullish Breakout from Range — Price clears the $272-275 resistance zone (upper Bollinger Band) and extends toward the July highs, supported by the golden cross, positive MACD and rising MAs. Trigger: daily close above $275.18 with volume above 35M. Target: $290-$300. Invalidation: close back below $256.50 (EMA50). (45% probability)
- Scenario 2: Neutral Range Continuation — Price keeps chopping between the EMA50/SMA50D support zone and the $272-275 resistance zone, consistent with ADX below 15. Trigger: failure to close above $275 and holds above $255. Target: $255-$272. Invalidation: close above $276 or below $250. (30% probability)
- Scenario 3: Bearish Rejection and Pullback — The CMF distribution proves right and the $272 double-top cap holds, sending price through the moving-average cluster toward VWAP and the lower band. Trigger: daily close below $254.80 (SMA50D) with MACD crossing below signal. Target: $240-$246. Invalidation: close above $275. (25% probability)
PRICE TARGETS
- Target Price: $277.00 (62-day, Jan 16, 2027)
- Expected Range: $246.00 to $304.00 (width $58.00, about 21.7% of the current price, in line with the 18-30% guidance for 61-180 days)
- Key Levels: Support at $256.50 (EMA50, with SMA50D at $254.81 just below), Resistance at $275.18 (upper Bollinger Band and top of the multi-month range)
OVERALL BIAS
OVERALL BIAS: BULLISH - Price is above all key moving averages, the golden cross is in place, MACD is positive and widening, and +DI is above −DI, which favors an upside break of the multi-month range over a 62-day horizon. Conviction is modest, because CMF is in distribution, ADX is weak at 12.9, and price faces heavy resistance at $272-275.
This is educational analysis and not financial advice.