SPY 4-day bullish forecast — Oct 30, 2026
- Bias: Bullish
- Timeframe: 4 days (made Oct 30, 2026, target date Nov 2, 2026)
- Price at analysis: $755.72
- Price target: $759.50
- Expected range: $745.00 – $771.00
- Result: Correct (-0.5%) — closed at $752.10 on Nov 2, 2026; quality score 100/100
Get a free AI analysis of SPY today
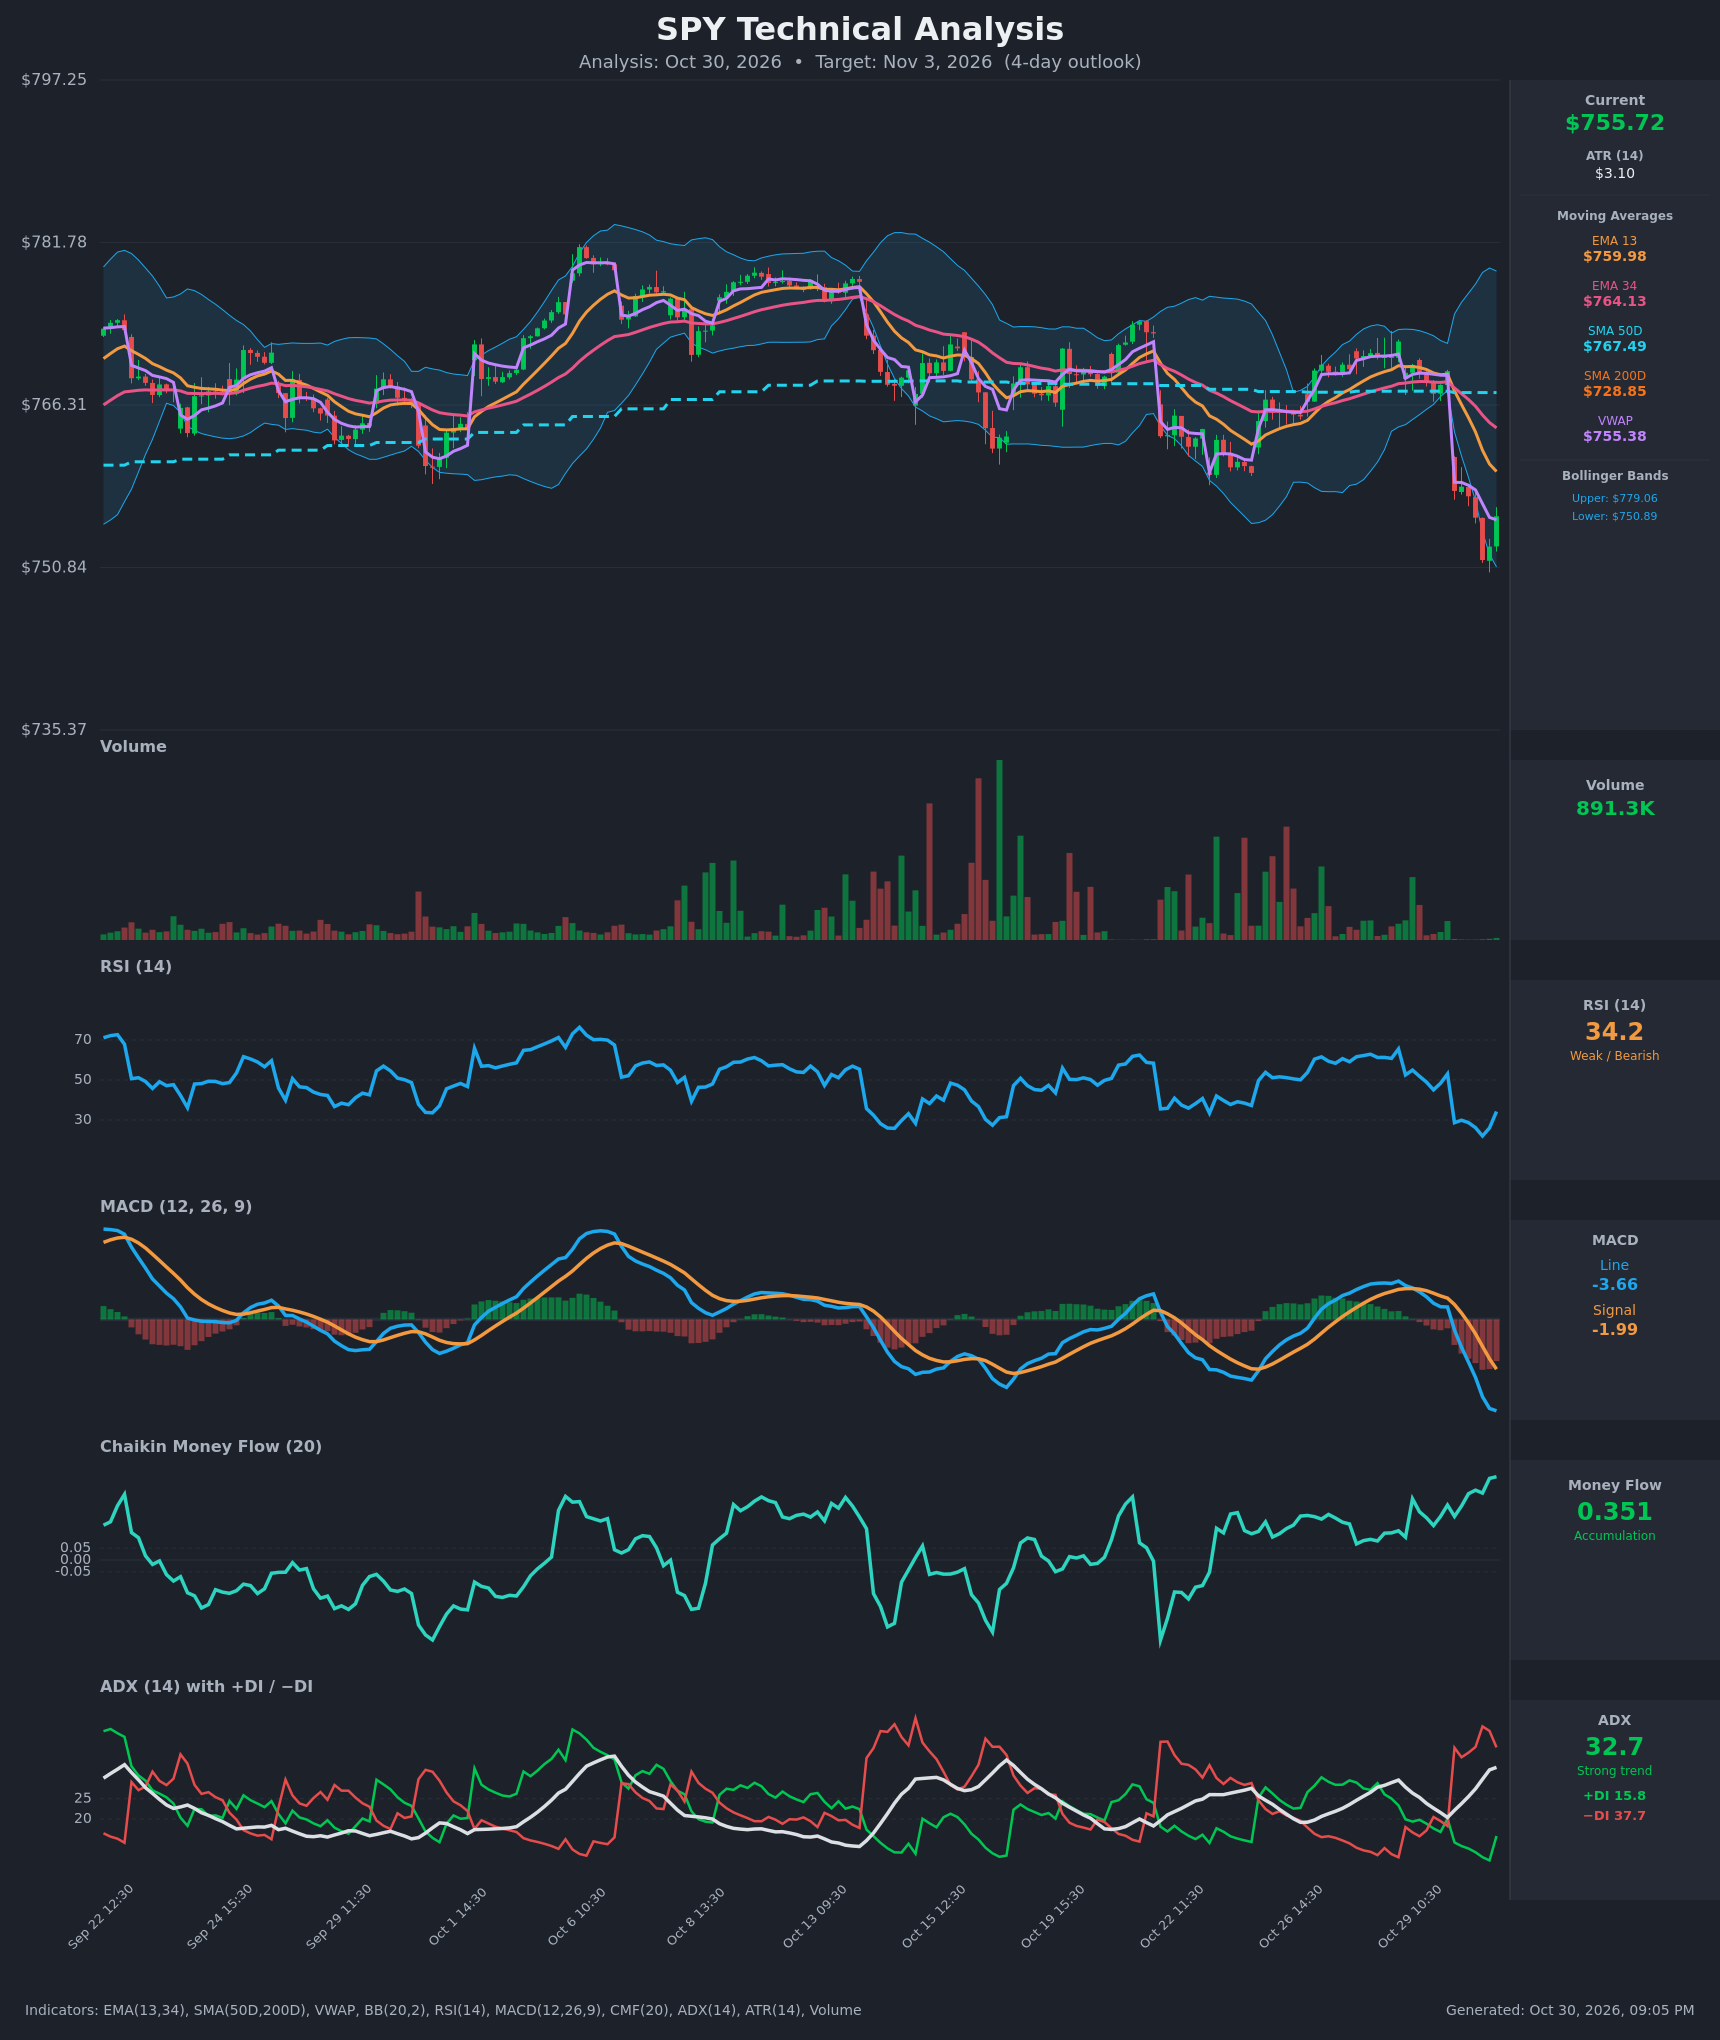
Analysis
TECHNICAL INDICATORS
- RSI (14): 34.22, up from a washed-out low of 22.0 at 13:30 on Oct 30. It is still below 50 and near oversold. The hook up shows early bounce momentum, but the trend remains weak. [Neutral]
- 20 EMA (EMA 13 / EMA 34 shown): EMA13 is $759.98 and EMA34 is $764.13. Price at $755.72 is below both, and EMA13 crossed below EMA34 on Oct 30. Both now act as overhead resistance. [Bearish]
- MACD: Line -3.66, signal -1.99, so the histogram is negative and widening. The bearish crossover happened on Oct 30 around 11:30, and the line is deeply below zero. The line has started to flatten (-3.57 to -3.66), which suggests the downside momentum burst is maturing. [Bearish]
- Bollinger Bands (20): Upper $779.06, lower $750.89, so price sits in the bottom ~15% of the band. The bands are wide after the gap-down. The $751.55 low tagged the lower band and the close bounced back inside. A band-walk is possible, but this looks more like a stretched move. [Neutral]
- CMF (20): 0.351 is strong accumulation and has been rising throughout the selloff. Price made lower lows while money flow stayed positive, so closes are landing in the upper part of their ranges. [Accumulation]
- ADX (14): 32.7 and rising, with −DI 37.7 above +DI 15.8. This is a strong bearish trend, though +DI is ticking up from 9.8 to 15.8 as the bounce begins. [Strong Trend – Bearish]
- Volume: 891.3K is modest next to the earlier spikes. The gap-down was sharp but not climactic, and the latest bar is green. Without heavy volume, the bounce lacks strong conviction. [Neutral / slightly weak confirmation]
Other context:
- Price is slightly above VWAP ($755.38), which is a marginal positive.
- Price is well above SMA200D ($728.85), so the long-term uptrend is intact.
- SMA50D ($767.49) is flat and sits above price, acting as resistance.
DIVERGENCES & TRENDS
- Bullish CMF divergence: price fell from ~$769 to ~$751 while CMF climbed to 0.351 (a new high). That suggests dip buying or absorption.
- RSI: the 22 low and the hook to 34 show oversold exhaustion. RSI is still below 50, so the trend has not yet turned.
- MACD / ADX: both are bearish and strongly trending. The MACD line is flattening and +DI has turned up, which are early hints of fading selling pressure.
- Crossovers: EMA13 crossed below EMA34, MACD crossed below signal, and −DI crossed above +DI, all on Oct 30. The gap-down from $769.53 to $758.13 is the key event.
- Trend structure: price is mostly range-bound at about $750–$781 over the past month, with the current bar at the bottom of that range. The ~$751 low also coincides with the lower BB and earlier swing lows.
CHART PATTERNS
- There is no clean textbook pattern. The broad ~$750–$781 range resembles a wide Bearish Expanding Triangle / large range, and the gap-down is a breakdown attempt from it.
- The sharp drop and tentative bounce at range support could develop into a Bearish Flag Pattern if the bounce stays shallow and capped by EMA13 near $760. A flag target would be a measured move toward $745 or lower.
- The alternative is a Bullish Double Bottom forming at ~$751 if the low holds on a retest. That would target the $760–$764 EMA zone first, then the SMA50D near $767.5.
- Neither pattern is confirmed. A reclaim of $760 or a break of $750.84 decides which one plays out.
POTENTIAL SCENARIOS
- Scenario 1: Bullish Oversold Mean-Reversion Bounce — RSI hooks up from near oversold, CMF shows accumulation, and price is at the range low and lower Bollinger Band. Price rebounds toward the EMA13 and VWAP-reclaim zone. Trigger: hold above $751 and a hourly close above $757–$758. Target: $759.50–$764. Invalidation: hourly close below $750.84. (50% probability)
- Scenario 2: Bearish Trend Continuation — ADX is strong with −DI dominant and MACD is deeply negative. The bounce stalls under EMA13 (~$760), forming a bear flag, then the $751 low breaks. Trigger: rejection at $759–$760 or a break below $750.84. Target: $745–$747. Invalidation: close above $764 (EMA34). (35% probability)
- Scenario 3: Neutral Choppy Basing — Price consolidates between ~$751 and $760 as the selloff digests. Trigger: low-volume chop with ADX flattening. Target: $753–$758. Invalidation: a decisive break outside the $750–$761 range. (15% probability)
PRICE TARGETS
- Target Price: $759.50 (4-day horizon, Nov 3)
- Expected Range: $745.00 to $771.00 (width $26.00, about 3.4% of current price, in line with the 3–5% guidance for a 4-day window and wider than a 2–3 day range)
- Key Levels: Support at $751.00, Resistance at $760.00
OVERALL BIAS
OVERALL BIAS: BULLISH - Bullish factors are an oversold RSI hook, a strong CMF accumulation divergence, and price at the lower Bollinger Band and range support. These favor a modest mean-reversion bounce toward the EMA13/$760 area. The trend indicators (ADX, MACD, EMA cross) remain bearish, so conviction is modest. A break below $750.84 would invalidate the bounce view.
This is educational analysis and not financial advice.