SOXL 7-day bearish forecast — Oct 31, 2026
- Bias: Bearish
- Timeframe: 7 days (made Oct 31, 2026, target date Nov 6, 2026)
- Price at analysis: $77.07
- Price target: $74.80
- Expected range: $73.00 – $79.20
- Result: Correct (-40.1%) — closed at $46.14 on Nov 6, 2026; quality score 50/100
Get a free AI analysis of SOXL today
Analysis
TECHNICAL INDICATORS
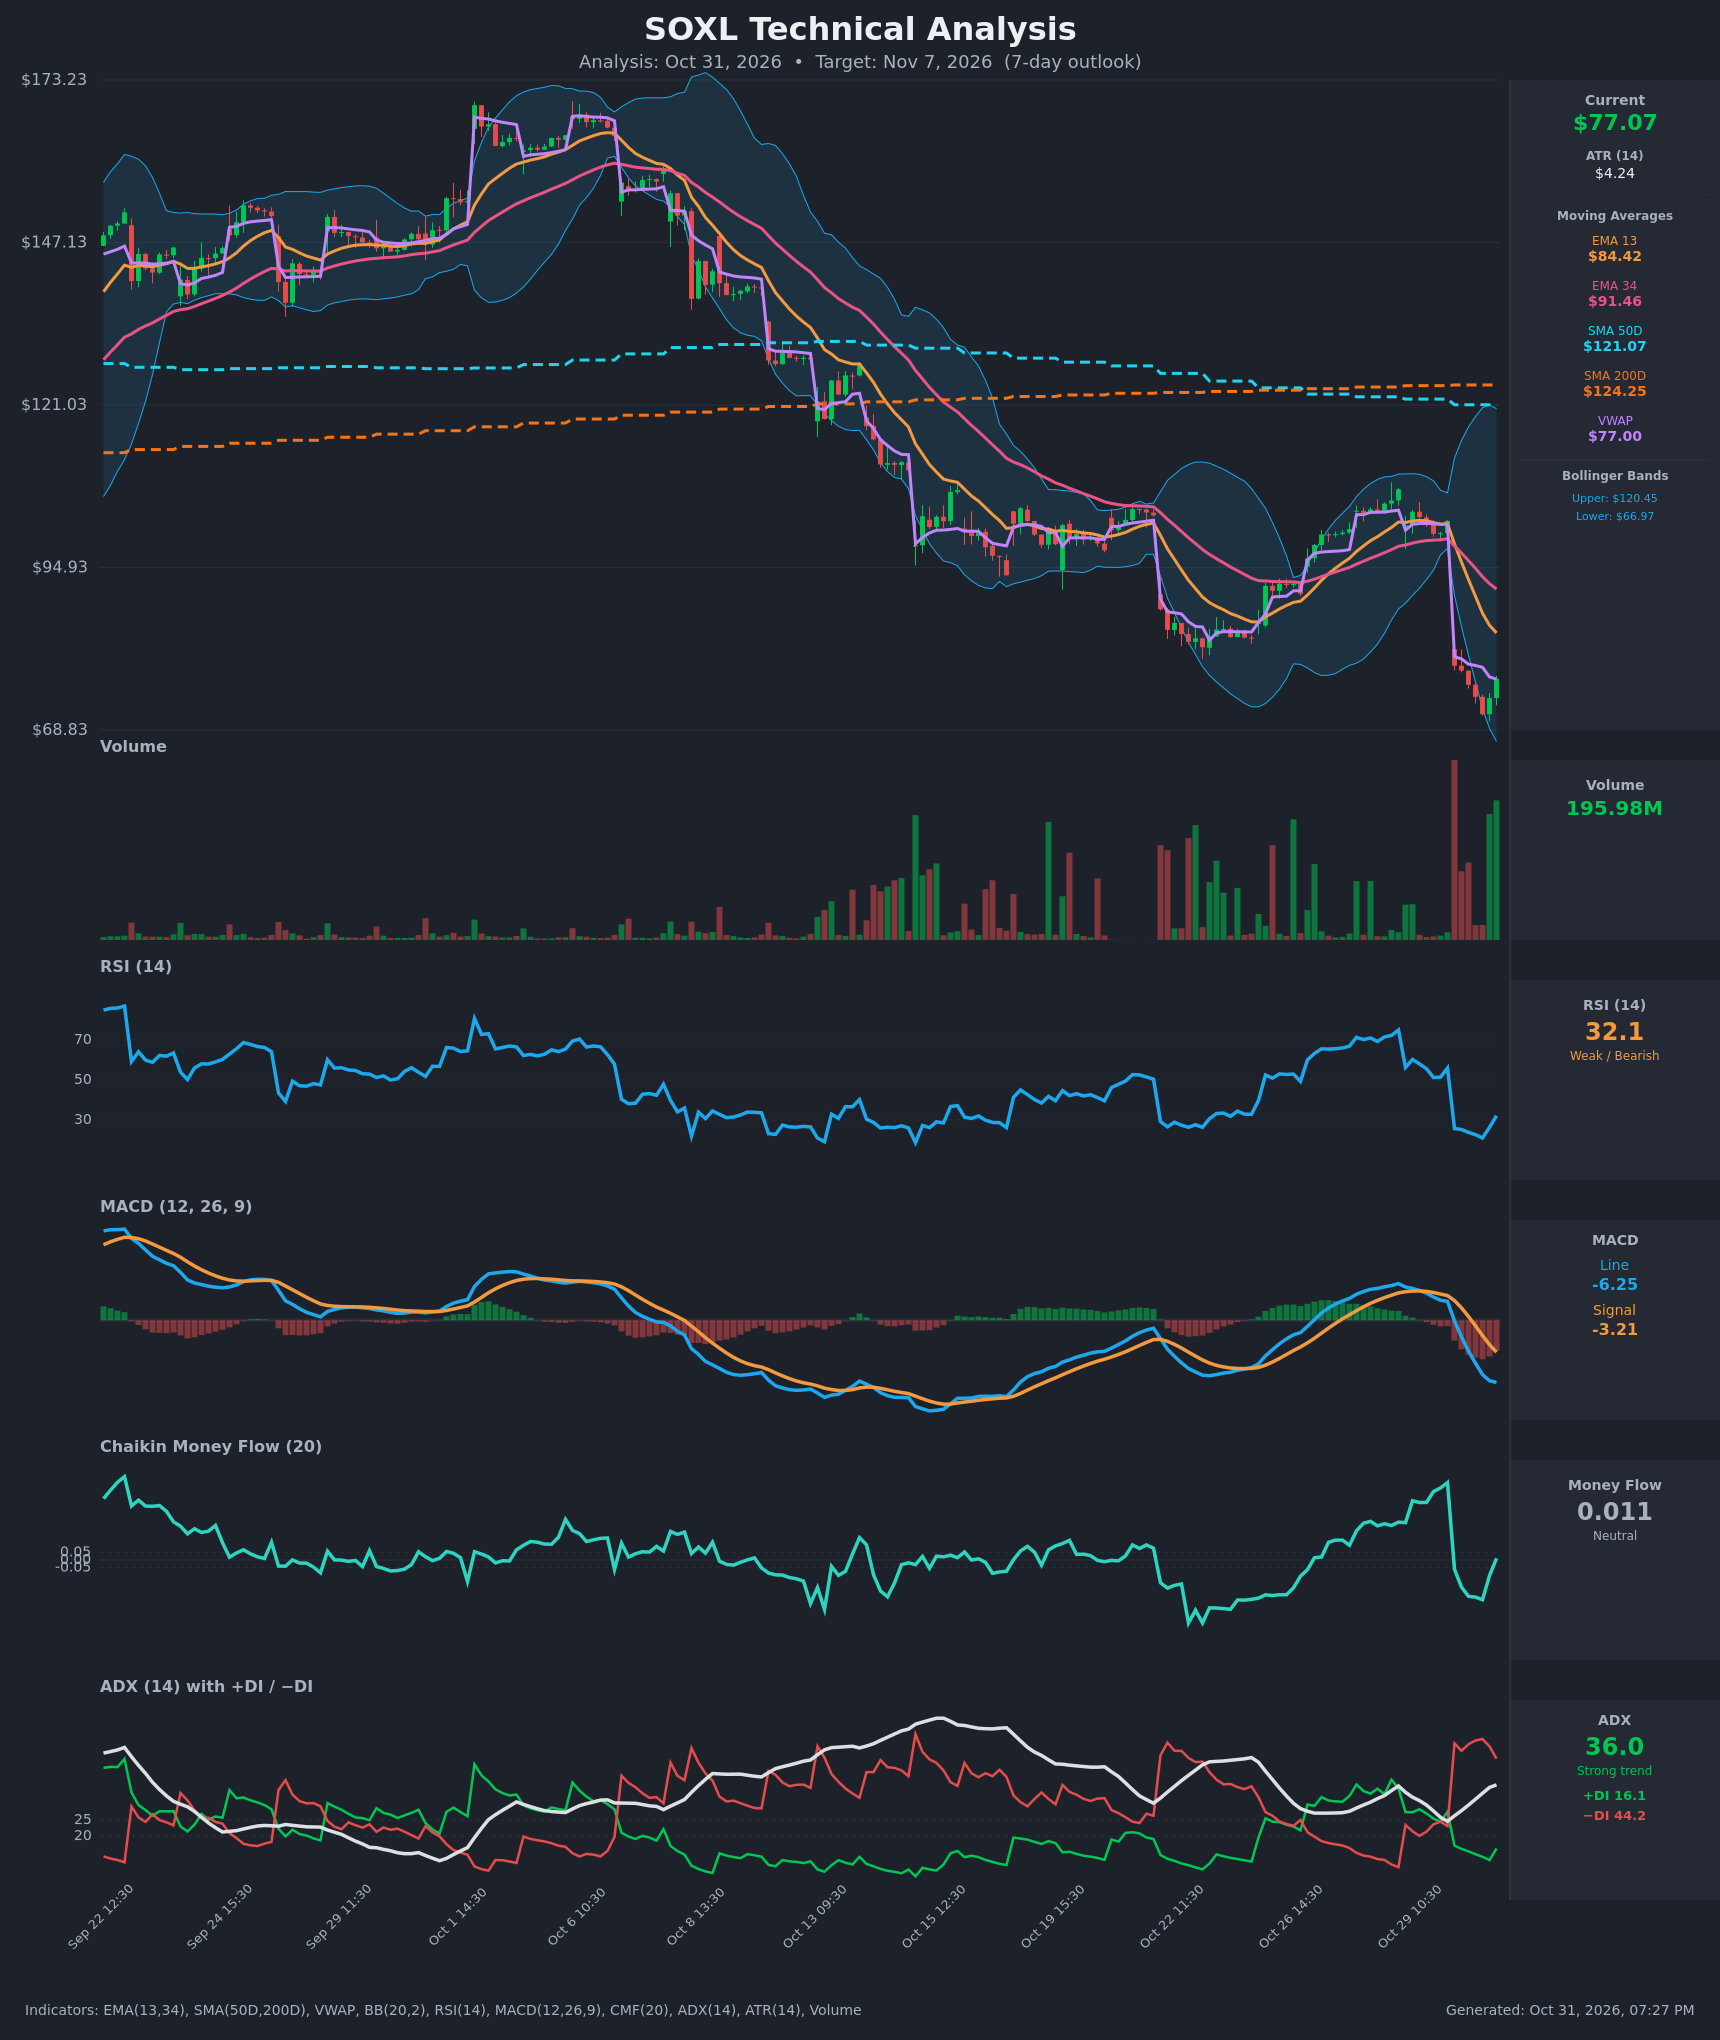
- RSI (14): 32.12, rebounding from a deeply oversold 21.0 low on Oct 30 but still below 50 and not yet back above 40. The bounce is a relief move, and momentum is still weak. [Bearish]
- 20 EMA (EMA 13 / EMA 34 used as short-term trend proxies): Price of $77.07 is well below EMA 13 ($84.42) and EMA 34 ($91.46). EMA 13 is below EMA 34 and the gap is widening, so both averages act as overhead resistance. [Bearish]
- MACD: Line at -6.25 is below the signal at -3.21, a histogram of about -3.04 that is still widening. The bearish crossover happened on Oct 30 and momentum is still accelerating down. [Bearish]
- Bollinger Bands (20): Upper $120.45, lower $66.97. The bands are very wide after the gap-down. Price sits in the lower third of the bands (%B ≈ 0.19), and the last bar bounced off the lower band without a clear reversal. [Bearish]
- CMF (20): 0.011, neutral (between -0.05 and +0.05). It recovered from -0.26 as the last two bars closed higher. Buying pressure is improving but not yet confirmed accumulation. [Neutral]
- ADX (14): 36.0 and rising, with −DI (44.2) far above +DI (16.1). This is a strong trend with bears in firm control, although −DI has started to ease slightly from 50.4. [Strong Trend – Bearish]
- Volume: 195.98M on the latest bar, among the heaviest on the chart. The huge volume on the Oct 30 gap-down bar looks like capitulation, and the green high-volume bounce bar shows some dip buying. Follow-through is unproven. [Climactic selling, tentative bounce]
DIVERGENCES & TRENDS
- No confirmed bullish divergence. RSI rose from 21 to 32 as price rose from $71.36 to $77.07, which is an oversold bounce rather than a divergence against a lower price low.
- Trend structure: SMA50D ($121.07) is below SMA200D ($124.25), so the death cross is already in place. Price is about 38% below SMA200D, a firmly long-term downtrend.
- Moving averages: The EMA 13/34 bearish cross is established and widening.
- VWAP: Price ($77.07) is almost exactly at VWAP ($77.00). The reclaim of VWAP is the first sign of a bounce, but it is only a neutral standoff.
- MACD: The bearish crossover is fresh with a widening histogram. The DI spread of −DI over +DI is about 28 points, which is bearish.
- Oversold conditions: RSI was at 21–26 for several bars, which raises the odds of a relief bounce. In strong ADX trends, such bounces usually fade at resistance.
CHART PATTERNS
- No clean reference pattern is complete. The price action is a vertical gap-down (about -23% in one bar) from the $102 area to about $79, followed by a lower-low slide to $71.36 and a small rebound.
- Possible Bearish Flag/Pennant: If the bounce stalls in a tight range below $80–$84, it would resemble the Bearish Flag/Pennant continuation pattern. The measured move from the gap points to a much lower area, but it is too early to confirm.
- Possible Bullish Falling Wedge / Double Bottom: A rebound that holds above $71.36 and clears $84 could start to look like a Bullish Double Bottom. That would need a retest of the lows and a break above the EMA 13, and neither is in place yet.
- Significance: The overall structure is a series of lower highs and lower lows below falling averages, a classic downtrend continuation setup. The nearest invalidation is a reclaim of EMA 13 near $84.
POTENTIAL SCENARIOS
- Scenario 1: Bearish Failed Bounce and Continuation — The relief rally stalls at VWAP/gap resistance ($79–$80) and the strong −DI-led trend resumes, retesting the Oct 30 lows. Trigger: rejection at $79.14 and a close back below $75. Target: $71.36–$72, with an extension toward the $67 lower band. Invalidation: a daily close above $84.42 (EMA 13). (50% probability)
- Scenario 2: Bullish Oversold Relief Rally — RSI climbs through 40, CMF turns positive, and price fills part of the gap. Trigger: a break above $79.14 on strong volume. Target: $84.42 (EMA 13), possibly $88. Invalidation: a close below $71.36. (33% probability)
- Scenario 3: Neutral Consolidation — Price chops between $72 and $80 as the market digests the gap. Trigger: low-volume drift around VWAP ($77.00). Target: $75–$78. Invalidation: a close outside $71.36–$80. (17% probability)
PRICE TARGETS
- Target Price: $74.80 (7-day)
- Expected Range: $73.00 to $79.20 (width $6.20, about 8.0% of current price, in line with 7-day guidance of ~4–8%)
- Key Levels: Support at $71.36, Resistance at $79.14
OVERALL BIAS
OVERALL BIAS: BEARISH - Price is far below every moving average, ADX is at 36 with −DI dominating, and MACD is making a fresh bearish crossover with a widening histogram. The oversold bounce (RSI 32, price at VWAP, CMF back to neutral) is likely to meet resistance near $79–$84 before the trend resumes.
This is educational analysis and not financial advice.