SOXL 27-day bearish forecast — Nov 15, 2026
- Bias: Bearish
- Timeframe: 27 days (made Nov 15, 2026, target date Dec 11, 2026)
- Price at analysis: $58.32
- Price target: $54.00
- Expected range: $49.50 – $58.50
- Result: Pending — graded after the close on Dec 11, 2026
Get a free AI analysis of SOXL today
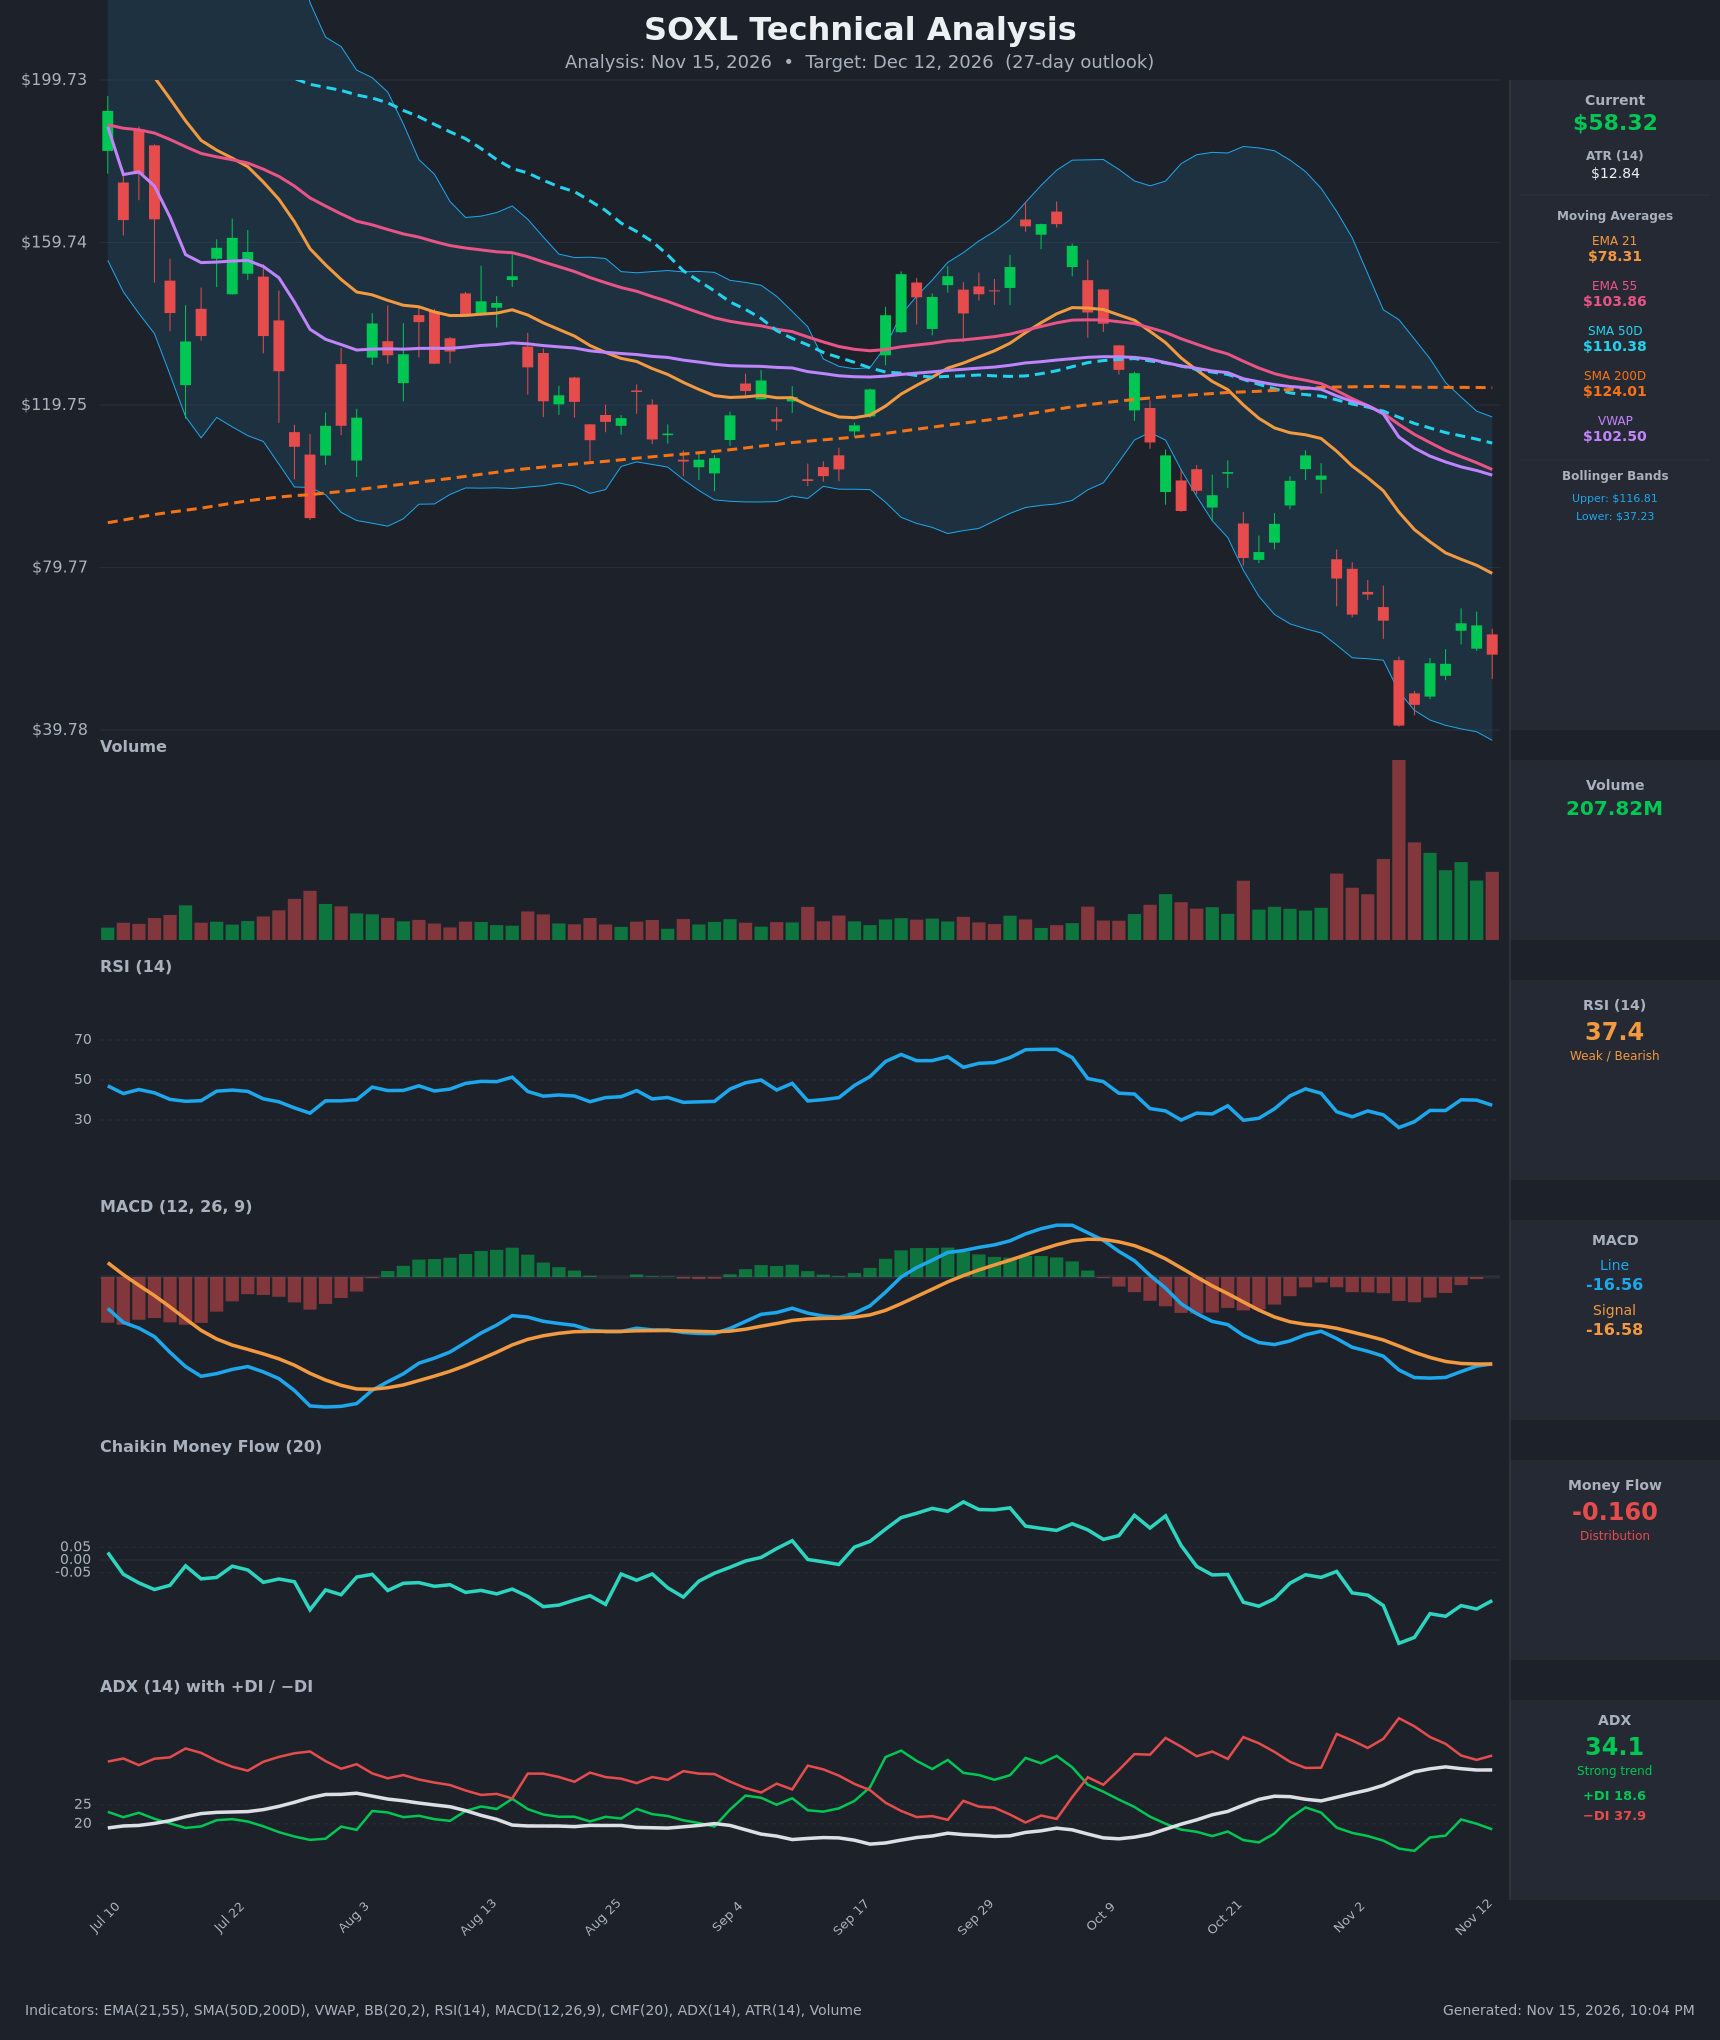
Analysis
TECHNICAL INDICATORS
- RSI (14): 37.4, below 50 and off the Nov 5 low of 26.2. The bounce to 40.1 on Nov 11 failed and RSI is rolling over again. It is not oversold, so there is room to fall. [Bearish]
- 20 EMA (EMA 21 = $78.31): Price is about 25% below the EMA 21 and it is falling steeply. It is also well below the EMA 55 ($103.86). The EMA 21 is the first dynamic resistance. [Bearish]
- MACD: Line -16.558 vs signal -16.582, a marginal bullish crossover with the histogram barely positive. Both lines are deeply negative and the line is still near its lows. The cross is weak and could easily reverse. [Neutral]
- Bollinger Bands (20): Bands are $37.23 to $116.81, very wide after the collapse. Price at $58.32 sits in the lower third, well below the midline (~$77). The Nov 5 low pierced the lower band and the bounce has since faded. Volatility is still expanding. [Bearish]
- CMF (20): -0.160, well below -0.05 and persistently negative since early October. It hit -0.328 at the capitulation low and has only partly recovered. [Distribution]
- ADX (14): 34.1, a strong trend, with −DI (37.9) well above +DI (18.6). The DI spread has narrowed slightly from the extreme, but sellers are clearly in control. [Strong Trend - Bearish]
- Volume: 207.82M on a red bar, well above the September-October average. The Nov 5 spike marked capitulation, and the bounce came on lower volume. Selling is returning on today's drop. [Bearish - distribution with elevated volume]
DIVERGENCES & TRENDS
- Moving averages: Price is below the SMA200D ($124.01), SMA50D ($110.38), EMA 55 and VWAP ($102.50). The SMA50D is rolling over toward the SMA200D, and a death cross is likely within weeks if the decline holds.
- MACD vs price: The MACD line made a slightly higher low than the Nov 5-6 lows while price tested lower. This is a mild bullish divergence and a possible relief bounce, but it is not confirmed.
- RSI: No clear divergence. The Nov 5 low (26.2) was followed by a lower high (40.1) at a price high of $66, so momentum is not recovering.
- Trend: Price has made lower highs ($107 → $73 → $66) and lower lows ($40.87). Today's $58.32 close, down from $65.53, shows the bounce failing.
- DI and CMF: −DI has stayed above +DI throughout, and CMF has stayed below -0.05, so there is no accumulation yet.
CHART PATTERNS
- Bearish continuation structure: The sharp drop, the bounce from $40.87 to about $66 and the renewed rejection resemble a Bearish Flag / Pennant. A break below the Nov 5-6 lows ($40.87-$45.97) would project roughly another $25 down (the prior drop height), toward the high $30s to low $20s. This is a long-range target, and this analysis does not assume it will be reached within 27 days.
- Alternative (unconfirmed): The tightening MACD and the bounce off the lower Bollinger Band could form a Bullish Falling Wedge or double bottom near $41-$46. This needs a close above $66 to confirm.
- Targets: On the bearish case, a retest of $45.97 and then $40.87. On the bullish case, $66, then $78 (EMA 21).
POTENTIAL SCENARIOS
- Scenario 1: Bearish Continuation Lower — The failed bounce resumes the downtrend, with price below every key moving average, −DI dominant and ADX above 30. Trigger: close below $55, then below $50. Target: $46-$50, with a possible test of $40.87. Invalidation: daily close above $66.03. (50% probability)
- Scenario 2: Bullish Relief Bounce — Oversold conditions, the marginal MACD cross and the lower-band bounce spark a rally. Trigger: close above $66.03 on rising volume and CMF back above -0.05. Target: $72-$78 (EMA 21). Invalidation: close below $45.97. (32% probability)
- Scenario 3: Neutral Range — Price chops between roughly $46 and $66 as volatility compresses. Trigger: failure to break either $45.97 or $66.03. Target: $52-$62. Invalidation: close outside the range. (18% probability)
PRICE TARGETS
- Target Price: $54.00 (27-day horizon, about 7.4% below current)
- Expected Range: $49.50 to $58.50 (width $9.00, about 15.4% of current price, in line with the 12-18% guidance for a roughly one-month horizon)
- Key Levels: Support at $45.97, Resistance at $66.03. Further support is at $40.87, and overhead resistance at $78.31 (EMA 21).
OVERALL BIAS
OVERALL BIAS: BEARISH - Price is below all major moving averages, −DI (37.9) is far above +DI (18.6) with ADX at 34, CMF is -0.16, and the latest bounce failed at lower highs. The marginal MACD cross and the proximity to the lower Bollinger Band argue for volatile bounces, but the evidence favors lower prices.
This is educational analysis and not financial advice.