SOXL 20-day bearish forecast — Nov 15, 2026
- Bias: Bearish
- Timeframe: 20 days (made Nov 15, 2026, target date Dec 4, 2026)
- Price at analysis: $58.32
- Price target: $53.50
- Expected range: $50.50 – $57.50
- Result: Pending — graded after the close on Dec 4, 2026
Get a free AI analysis of SOXL today
Analysis
TECHNICAL INDICATORS
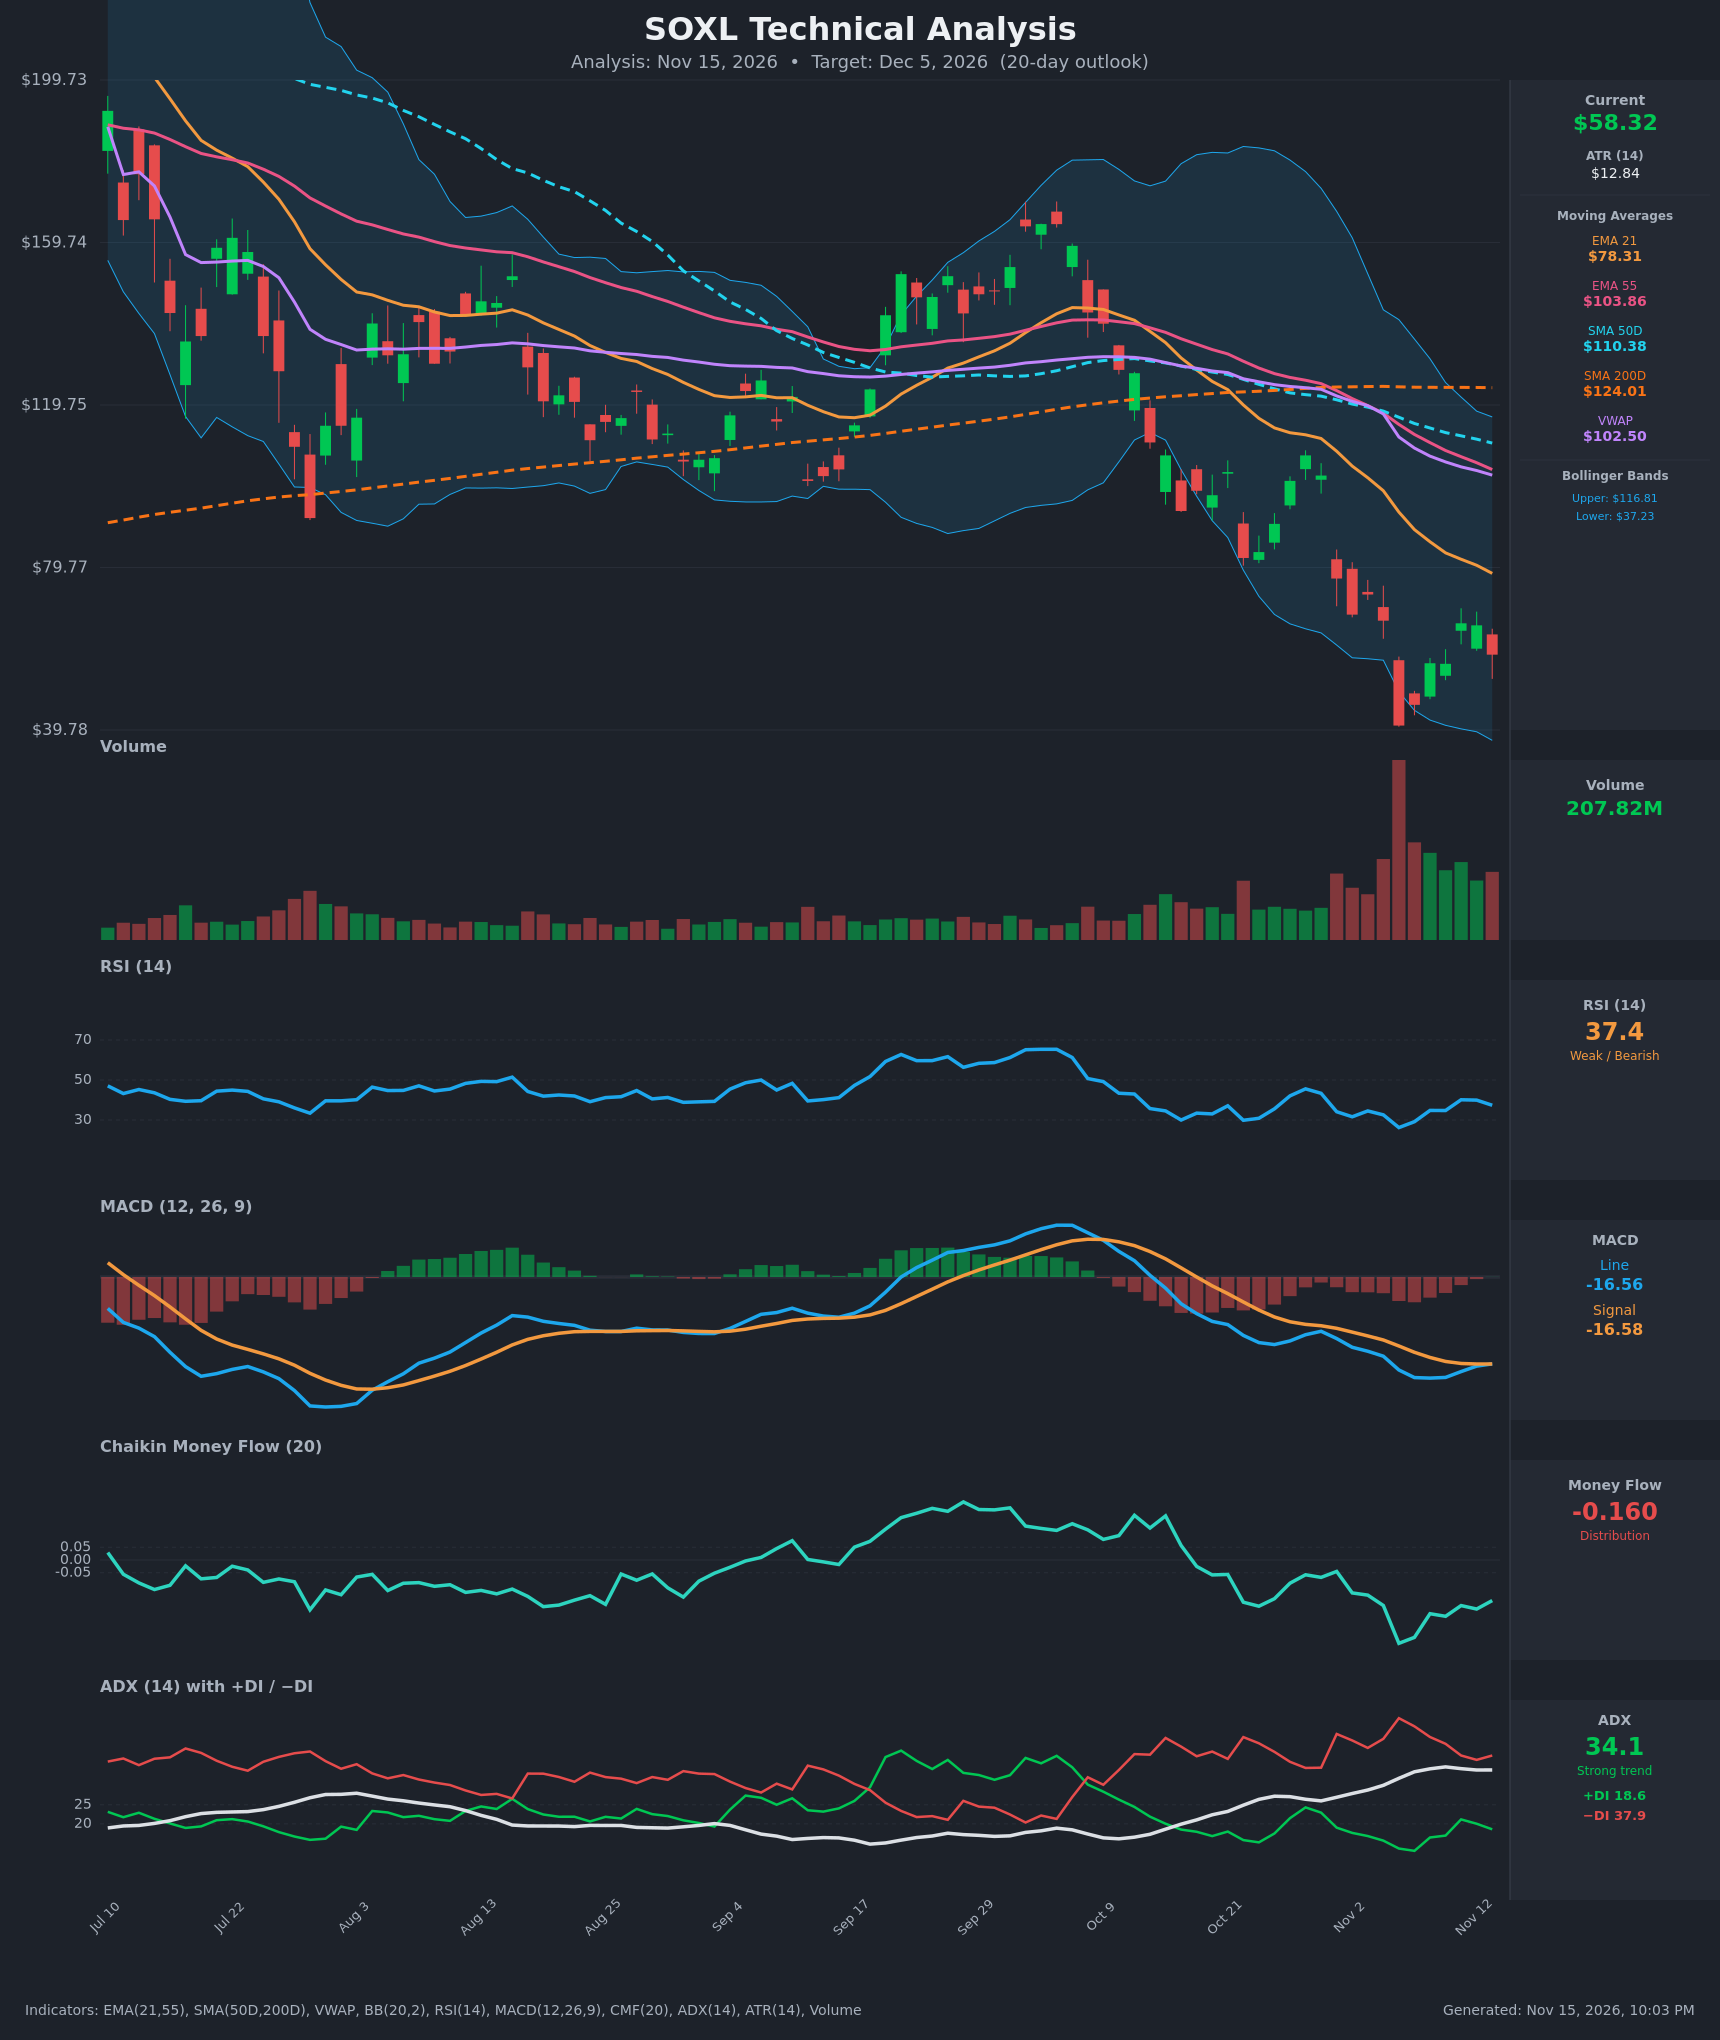
- RSI (14): 37.37. It is below the 50 midline but above oversold. It bottomed at 26.2 on Nov 5 and bounced to 40.1 on Nov 11, then rolled over to 37.4 as price fell back. The recovery was shallow and failed under 45. [Bearish]
- 20 EMA (EMA 21): $78.31, and still falling steeply (from $114 on Oct 26). Price is about 25% below it, so it acts as overhead resistance. EMA 21 is also well below EMA 55 ($103.86), so the bearish alignment is intact. [Bearish]
- MACD: Line -16.558 vs. signal -16.582, a histogram of roughly +0.02. The line has just edged back above the signal, which is a marginal, unconfirmed bullish cross. Both lines sit deeply negative near their lows, so this is only a pause in downside momentum, not a reversal. [Neutral]
- Bollinger Bands (20): Upper $116.81, lower $37.23, midline about $77. Price at $58.32 is in the lower half of very wide bands, well off the lower band after the $40.87 close. The wide bands show expanded volatility. Price walked the lower band during the Nov 5 capitulation, and the bounce has stalled well below the midline. [Bearish]
- CMF (20): -0.160, firmly below -0.05. It troughed near -0.33 on Nov 5 and has only partly recovered. Selling pressure still dominates. [Distribution]
- ADX (14): 34.1 and rising from 26 (Oct 29 to Nov 13), which signals a strong trend. −DI (37.9) is far above +DI (18.6). A brief +DI rise to 21 faded again, and the bears are still in control. [Strong Trend – Bearish]
- Volume: 207.82M. Volume spiked to a huge capitulation level on the Nov 5 breakdown to $40.87 and has stayed elevated since. The down days (Nov 3-4 and today) carry heavy volume, while the bounce days show a bit less participation. This looks like a post-capitulation chop rather than a confirmed bottom. [Elevated – Bearish tilt]
DIVERGENCES & TRENDS
- No bullish RSI divergence: price made a new low ($40.87) at RSI 26 and has not yet retested it with a higher RSI low. The RSI low is as extreme as the price low, so there is no divergence signal.
- MACD: the lines have flattened and a micro-cross has formed, but this is an early, weak sign inside a bearish structure. Both lines are still near -16.5.
- Moving averages: a death cross is in place. SMA50D ($110.38) is below SMA200D ($124.01) and the gap is widening. EMA 21 < EMA 55 < SMA50D < SMA200D, so the structure is fully bearish. Price is far below SMA200D (long-term downtrend).
- VWAP: price is far below VWAP ($102.50), which confirms sellers are in control.
- Trend of highs: the recent rally peaked at $66.03 (Nov 11) after a prior bounce high of about $73 (Nov 3). Lower highs persist.
- Trend indicators: ADX is rising with −DI dominant, and CMF is deeply negative. Both confirm trend continuation.
CHART PATTERNS
- Bearish Flag / Pennant (continuation): after the vertical drop from ~$107 to ~$41, the bounce to $66 and the rollover resemble a bearish flag/pennant. A break below the $56 / $46 area would project further downside. The measured move of the prior leg is large, but a conservative target is the $41-$46 zone.
- Possible Bullish Double Bottom (reversal, unconfirmed): it requires a successful retest of $41 plus a break above the $66 neckline. That has not happened, and a close above $66 would be needed to give it credibility. The probability is lower than the continuation pattern.
- Context: the major lower-high sequence is a descending trend structure, and the bounce is a counter-trend rally within it.
POTENTIAL SCENARIOS
- Scenario 1: Bearish Flag Continuation Lower — The relief bounce has failed under the $66 lower high and the trend resumes. Trigger: a daily close below $55-56 on heavy volume, with −DI staying above 35 and CMF staying negative. Target: $50, then a retest of $45.97 and possibly $41. Invalidation: a daily close above $66. (55% probability)
- Scenario 2: Bullish Relief Rally / Double Bottom — Capitulation lows hold and price mean-reverts toward falling resistance. Trigger: a close above $66 with CMF crossing back toward zero and MACD turning positive. Target: $70-$78 (EMA 21 at about $78). Invalidation: a close below $45.97 and then $40.87. (30% probability)
- Scenario 3: Neutral Choppy Base — Price consolidates in the $48-$66 range as volatility cools after the capitulation. Trigger: ADX rolling over below 30 with price oscillating around $58. Target: $55-$62. Invalidation: a close beyond either $66 or $46. (15% probability)
PRICE TARGETS
- Target Price: $53.50 (20-day, Dec 5, 2026)
- Expected Range: $50.50 to $57.50 (width $7.00, about 12.0% of the current price; sized to the 14-21 day guidance, though SOXL's ATR of $12.84 means actual moves could be wider)
- Key Levels: Support at $45.97, Resistance at $66.00
OVERALL BIAS
OVERALL BIAS: BEARISH - Price is below every moving average with a death cross in place. −DI (37.9) is far above +DI (18.6) with ADX at 34 and rising, CMF is at -0.16, and the bounce has failed beneath the $66 lower high. The marginal MACD cross and the post-capitulation volume leave a relief-rally risk, but the evidence favors continuation lower.
This is educational analysis and not financial advice.