SOXL 62-day bearish forecast — Nov 15, 2026
- Bias: Bearish
- Timeframe: 62 days (made Nov 15, 2026, target date Jan 15, 2027)
- Price at analysis: $58.32
- Price target: $52.00
- Expected range: $44.00 – $61.50
- Result: Pending — graded after the close on Jan 15, 2027
Get a free AI analysis of SOXL today
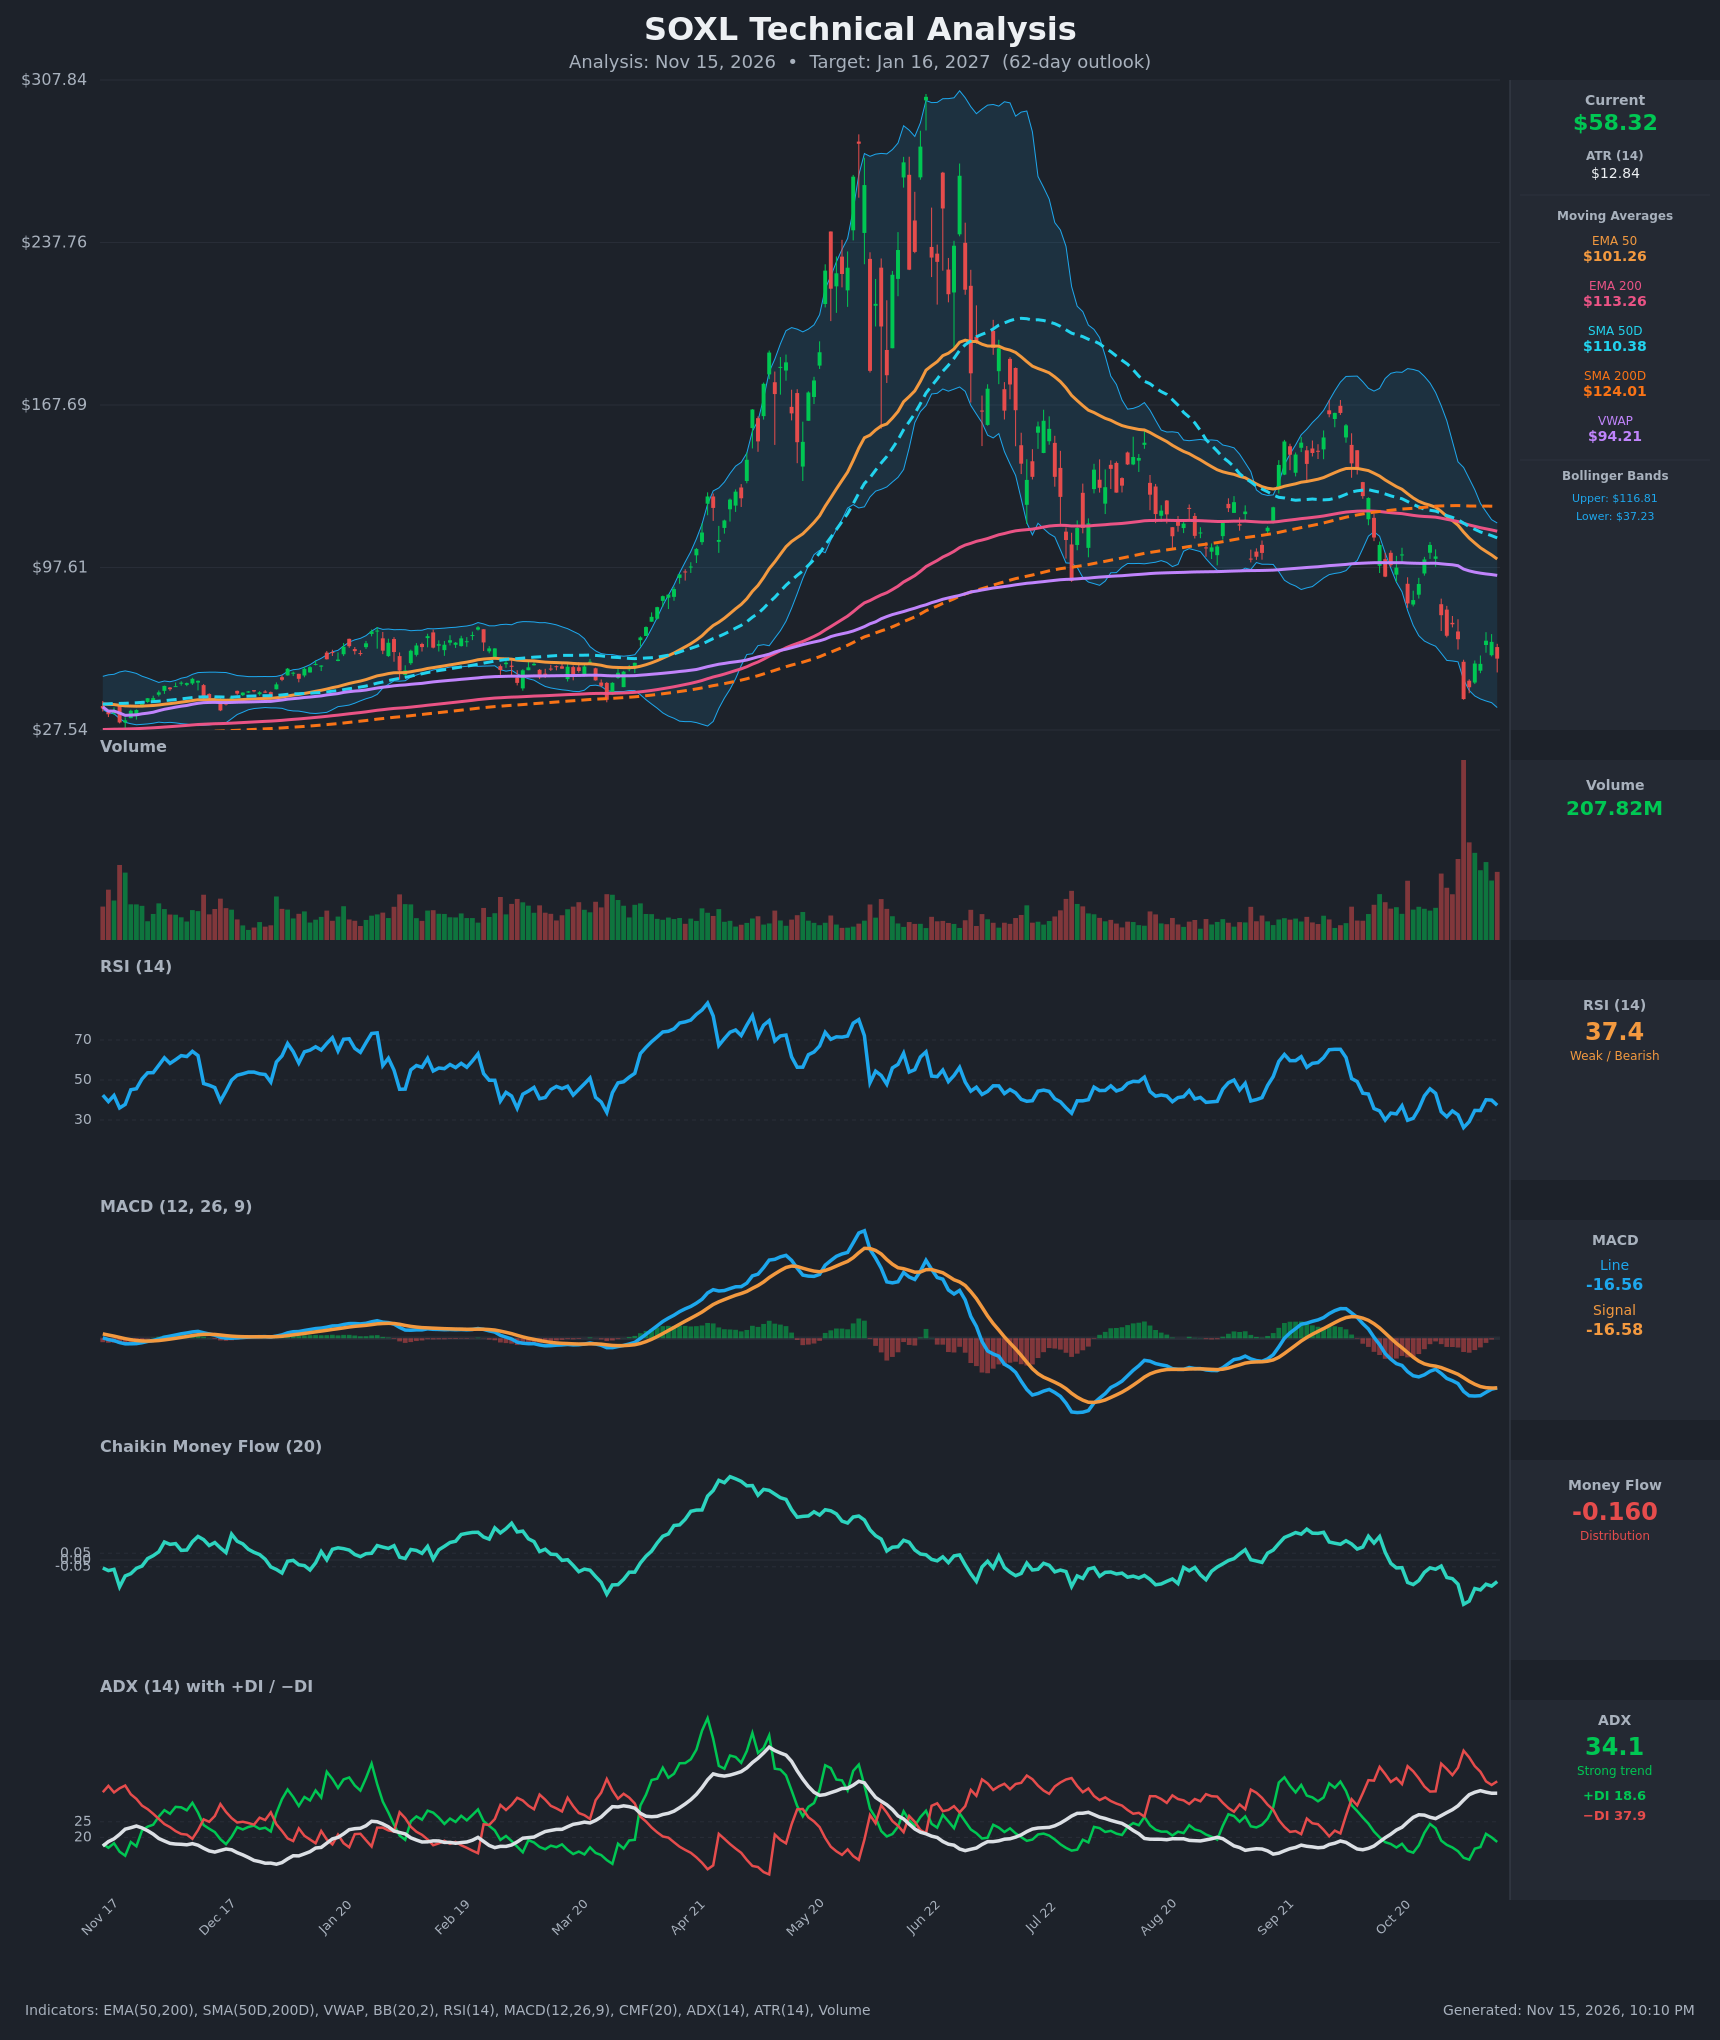
Analysis
TECHNICAL INDICATORS
- RSI (14): 37.37, below 50 and off the Nov 5 low of 26.2 (oversold). The bounce stalled around 40 on Nov 11 and RSI has turned down again (40.1 → 37.4). Momentum is weak with no confirmed reversal. [Bearish]
- 20 EMA: The chart shows no 20 EMA, so I use the EMA 50 as the nearest proxy. It is $101.26 versus a price of $58.32, so price is about 42% below it. EMA 50 is also below EMA 200 ($113.26), a bearish EMA cross, and both are falling and act as overhead resistance. [Bearish]
- MACD: Line -16.558 vs signal -16.582, a histogram of about +0.02. This is a marginal flat or bullish crossover, but both lines are deeply negative near their lows. The line has stopped falling after the Nov 9 low of -19.3 but has no real upside momentum. [Neutral]
- Bollinger Bands (20): Upper $116.81, lower $37.23, midline about $77. Price is in the lower half, having bounced off the lower band (Nov 5 close of $40.87 was near it). The bands are very wide after the volatility expansion. A reversion toward the midline is possible, but the trend is walking down the lower half of the bands. [Bearish]
- CMF (20): -0.160, well below -0.05, with a trough of -0.328 on Nov 5. It has recovered slightly but remains firmly negative, which shows sustained distribution. [Distribution]
- ADX (14): 34.1 and rising from the mid-20s, with -DI (37.9) far above +DI (18.6). This is a strong, established downtrend. The recent bounce has not produced a DI cross. [Strong Trend – Bearish]
- Volume: 207.82M, a huge spike versus the year's average. The peak came during the Nov 5 capitulation drop. Volume stays elevated on the bounce, but there is no clear accumulation signature. Heavy volume on the breakdown validates the move lower. [Bearish confirmation, with possible capitulation]
Other context from the exact data:
- Price is below every moving average: EMA 50, EMA 200, SMA 50D ($110.38), SMA 200D ($124.01) and VWAP ($94.21).
- SMA 50D is below SMA 200D, a death cross that is already in force.
DIVERGENCES & TRENDS
- Possible bullish divergence (weak): RSI made a higher low (34.7 on Nov 10 vs 26.2 on Nov 5) and MACD flattened. Price's retest of $56 held above the $40.87 low. This is only a relief signal, not a reversal, and RSI is now rolling over.
- Trend: Lower highs from the ~$300 peak (June) to ~$165 (Sep) to ~$107 (Oct 28), and now a lower high near $66 on Nov 11. The structure is a clear downtrend.
- Crossovers:
- EMA 50 crossed below EMA 200 on about Nov 3-4.
- The SMA death cross is in force.
- MACD is hugging its signal line, with a marginal positive histogram.
- −DI has dominated +DI since October.
- ADX: Rising ADX with −DI dominant means the downtrend is gaining strength, not exhausting.
- CMF: It has been negative since late October and makes lower lows with price.
CHART PATTERNS
- Bearish flag / descending-structure continuation: The sharp drop from $107 to $40.87 was followed by a bounce to $66. That bounce failed at the lower high near $66 (Nov 11) and has turned back down. This resembles a bearish flag or pennant (diagram, Continuation Patterns), and a break below ~$55 would target a measured move toward the mid-$40s or lower.
- Failed range / descending triangle: From July to October price consolidated in roughly a $97-$140 band, then broke down through the support area on heavy volume. That breakdown roughly matches the measured move (~$57), so the first leg of the target may already be achieved.
- Larger picture: The peak at ~$300 followed by a lower high is a large bearish reversal structure (resembling a double top / head-and-shoulders). The breakdown below the $97 neckline-like area confirms it.
- Bullish caveat: A double-bottom attempt at $40.87–$45.97 is possible, but it needs a break above ~$66.
POTENTIAL SCENARIOS
- Scenario 1: Bearish Trend Continuation — The downtrend continues with a strong ADX, −DI dominance and distribution. Price is capped by the $66 lower high and the falling MAs, and drifts back toward the Nov 5-6 lows. Trigger: a close below ~$55 and then below $45.97. Target: $45-$50, with an extension to $40.87 or lower. Invalidation: a daily close above $66-$67 on rising volume. (50% probability)
- Scenario 2: Bullish Relief Rally / Double-Bottom Base — The oversold reading, the flat MACD and the extreme volatility fuel a mean-reversion bounce toward the middle of the Bollinger Bands. Trigger: a close above $66 with RSI above 50 and CMF turning positive. Target: $75-$80 (midline). Invalidation: a close below $45.97. (30% probability)
- Scenario 3: Neutral Choppy Range — Price chops between the $41-$46 area and $66 as the volatility settles. Trigger: ADX rolling over and repeated failures at both extremes. Target: $52-$62. Invalidation: a close outside $41-$66. (20% probability)
PRICE TARGETS
- Target Price: $52.00 (62-day target, Jan 16, 2027)
- Expected Range: $44.00 to $61.50 (width $17.50, about 30% of the current price, consistent with the 61-180 day guidance)
- Key Levels: Support at $45.97 (with the deeper $40.87 low below), Resistance at $66.03
OVERALL BIAS
OVERALL BIAS: BEARISH - The price is below all key moving averages with a death cross in force, ADX is 34 with −DI far above +DI, CMF is -0.16, and the bounce has stalled at a lower high near $66. A relief rally is possible given the oversold conditions and flat MACD, but the evidence favors the trend continuing lower.
This is educational analysis and not financial advice.