SOXL 34-day bearish forecast — Nov 15, 2026
- Bias: Bearish
- Timeframe: 34 days (made Nov 15, 2026, target date Dec 18, 2026)
- Price at analysis: $58.32
- Price target: $52.00
- Expected range: $47.50 – $58.50
- Result: Pending — graded after the close on Dec 18, 2026
Get a free AI analysis of SOXL today
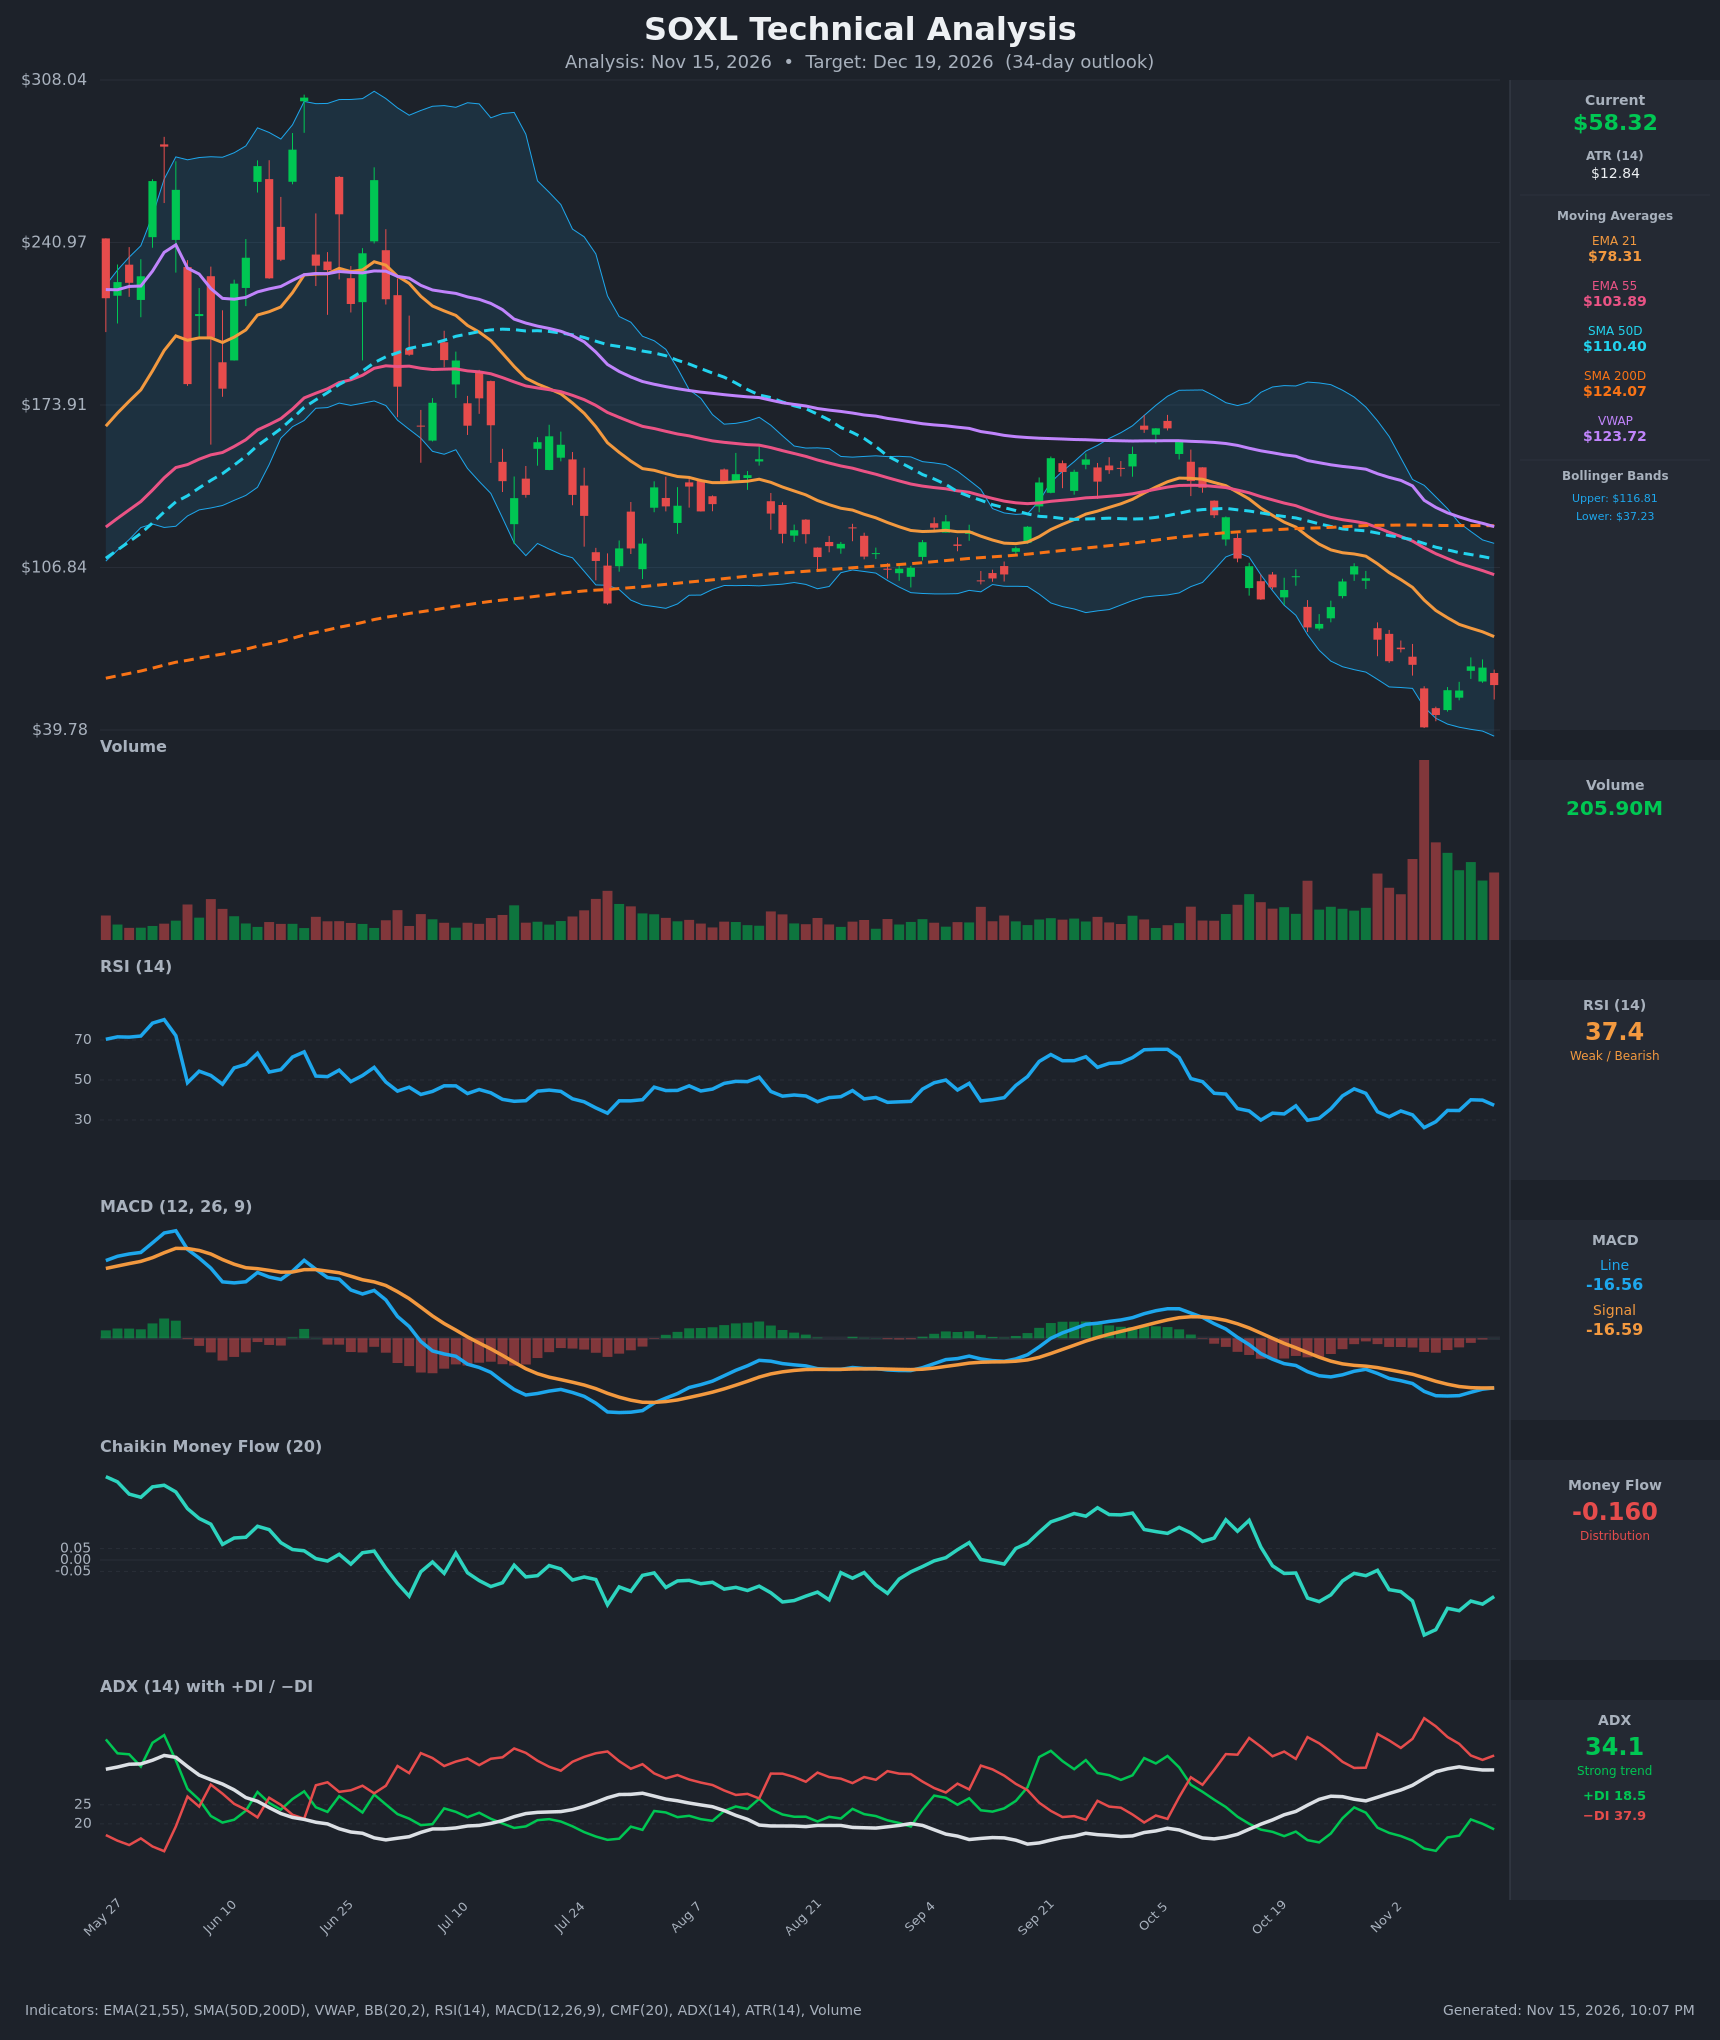
Analysis
TECHNICAL INDICATORS
- RSI (14): 37.4, below the neutral 50 but not oversold. It bottomed at 26.2 on Nov 5 and bounced to 40.1 on Nov 11. It has since rolled over to 37.4, which looks like a failed relief bounce under 40-45. [Bearish]
- 20 EMA (EMA 21): $78.31 and falling steeply (from $114 on Oct 26). Price at $58.32 is about 25% below it, so it acts as overhead resistance. EMA 21 is also well below EMA 55 ($103.89), a bearish stack. [Bearish]
- MACD: Line -16.56 vs signal -16.59, a histogram of about +0.03. The line has just barely crossed back above the signal, but both are deeply negative and flat near their lows. This is a marginal, low-quality momentum stabilization, not a bullish reversal. [Neutral]
- Bollinger Bands (20): Upper $116.81, lower $37.23, so the bands are very wide after the volatility spike. Price at $58.32 sits in the lower third, well off the lower band. The Nov 5 close ($40.87) pierced the lower band area and was bought. Price is walking the lower half of the bands, consistent with a downtrend. [Bearish]
- CMF (20): -0.160, well below -0.05. It is persistently negative, with a trough of -0.328 on Nov 5 and only a partial recovery. Sellers are still in control of money flow. [Distribution]
- ADX (14): 34.1, a strong and rising trend (27 → 34 over two weeks). −DI at 37.9 sits far above +DI at 18.5, so bears are firmly in control. [Strong Trend – Bearish]
- Volume: 205.90M, elevated relative to the earlier part of the chart. The huge capitulation spike on Nov 5 was followed by a high-volume bounce and then fading rallies. Volume is heavy on down days, and the latest decline on Nov 13 came on above-average volume. [Bearish – distribution/capitulation not yet resolved]
DIVERGENCES & TRENDS
- No clear bullish divergence: Price made a new low on Nov 5 ($40.87) and RSI made a new low (26.2) with it. RSI has not diverged, so there is no confirmed bottom signal.
- Moving average structure: The death cross (SMA50 crossing below SMA200) occurred around Oct 26. SMA50 ($110.40) is now below SMA200 ($124.07). EMA21 < EMA55 < SMA50 < SMA200 is a fully bearish alignment, and price is far below all of them and below VWAP ($123.72).
- MACD: The tiny bullish cross is occurring at deeply negative levels, which is typically a weak, pause-type signal. Its Nov 9–12 histogram improvement stalled.
- ADX/DI: −DI has been above +DI throughout the recent decline. +DI attempted a rise to 21 on Nov 11 but has faded again.
- CMF: Making lower lows and failing to reclaim zero, which confirms selling pressure.
- Price action: The series of lower highs ($107 → $73 → $66) and lower lows continues. The bounce from $40.87 to $66 failed and retreated to $58.32.
CHART PATTERNS
- Bearish Flag / Pennant (continuation): After the vertical collapse from about $102 to about $41, the rebound to $66 and pullback to $58 resembles a bearish flag or relief-bounce channel. A break below the Nov 5 low ($40.87) would project a measured move toward the high-$30s or lower.
- Possible Bullish Double Bottom / Falling Wedge (unconfirmed): The capitulation low at $40.87 could form the first leg of a double bottom, but it would need a retest and hold above about $40 plus a break above $66. Neither is confirmed, so it is a lower-probability alternative.
- Overall: The dominant structure is a bearish continuation under a downward-sloping moving average stack. Any rally toward the $66–$78 zone (the Nov 11 high and EMA21) is likely to meet supply.
POTENTIAL SCENARIOS
- Scenario 1: Bearish Continuation / Retest of Lows — Rallies fail beneath the $66 area and the downtrend (ADX 34, −DI dominant, CMF negative) resumes toward the Nov 5 low. Trigger: a close below about $54 and a renewed MACD/signal bearish cross. Target: $46–$50 initially, with a possible break below $40.87 toward the $37 lower Bollinger Band. Invalidation: a daily close above $66.03. (50% probability)
- Scenario 2: Bullish Relief Rally / Base Formation — The capitulation low holds, a double-bottom-style base forms, and price squeezes back toward the EMA21. Trigger: a close above $66 with RSI above 50 and CMF rising above zero. Target: $72–$78 (EMA21 at $78.31). Invalidation: a close below $50 or a new low under $40.87. (30% probability)
- Scenario 3: Neutral Choppy Consolidation — Price chops between $45 and $66 while volatility compresses after the capitulation spike. Trigger: failure of both the $66 breakout and the $41 breakdown. Target: $52–$62. Invalidation: a decisive break of either boundary on volume. (20% probability)
PRICE TARGETS
- Target Price: $52.00 (34-day)
- Expected Range: $47.50 to $58.50 (width $11.00, about 18.9% of current price, consistent with the 30–60 day guidance)
- Key Levels: Support at $40.87 (Nov 5 capitulation low), Resistance at $66.03 (Nov 11 swing high)
Note: ATR is $12.84, which implies far more daily volatility than this range suggests, so outcomes outside the range are quite possible.
OVERALL BIAS
OVERALL BIAS: BEARISH - Price is below every moving average and VWAP, with a death cross in place, ADX at 34 with −DI far above +DI, CMF at -0.16, and a failed bounce under 40-45 RSI. The marginal MACD cross is too weak to offset this, though a capitulation-low bounce keeps relief rallies possible.
This is educational analysis and not financial advice.