SOXL 83-day bearish forecast — Nov 15, 2026
- Bias: Bearish
- Timeframe: 83 days (made Nov 15, 2026, target date Feb 5, 2027)
- Price at analysis: $58.32
- Price target: $52.00
- Expected range: $43.50 – $61.00
- Result: Pending — graded after the close on Feb 5, 2027
Get a free AI analysis of SOXL today
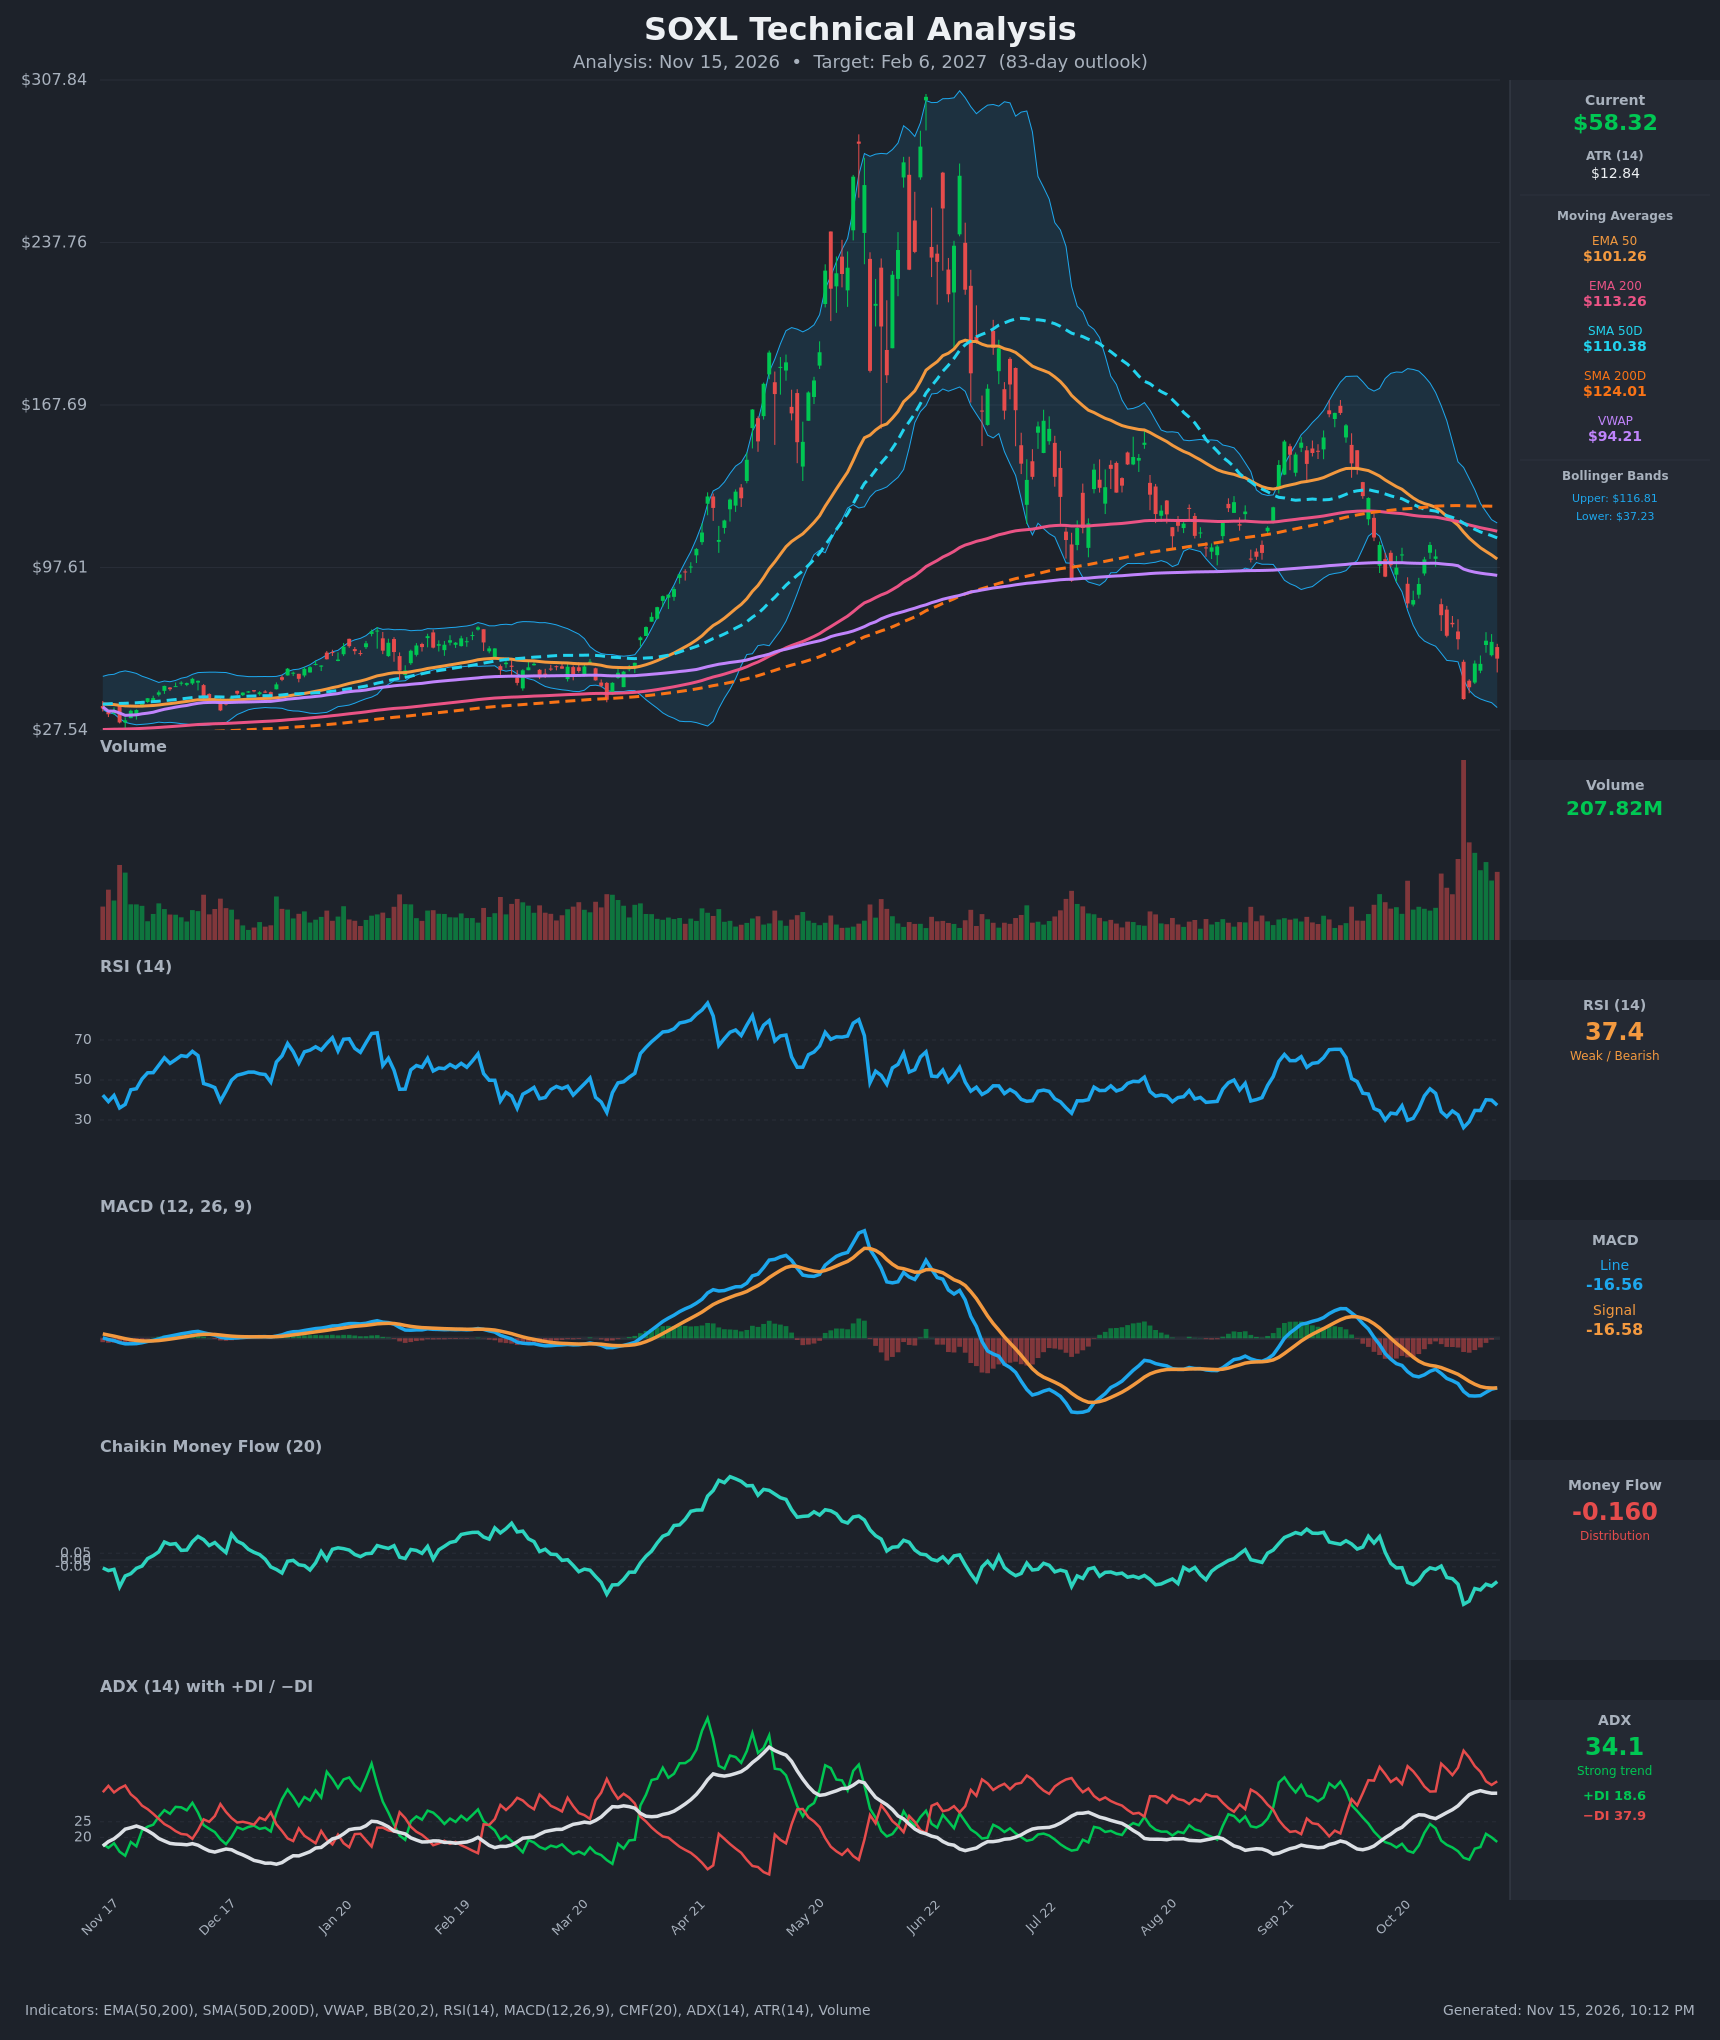
Analysis
TECHNICAL INDICATORS
- RSI (14): 37.37, in the bearish zone below 50 but not oversold. It bounced from a capitulation low of 26.2 on Nov 5 and peaked near 40 on Nov 11. It has since rolled over from 40.1 to 37.4, so the relief bounce is fading. [Bearish]
- 20 EMA: The 20 EMA isn't supplied. Using the EMA 50 at $101.26 as the nearest reference, price at $58.32 is about 42% below it and the EMA is falling steeply. It acts as heavy overhead resistance. A 20 EMA would also sit well above price, in the $65-75 area. [Bearish]
- MACD: The line is -16.558 and the signal is -16.582, so the histogram is about +0.02. The line barely crossed above the signal on Nov 13. Both lines are deeply negative, far below zero. This is a marginal momentum stabilization, not a real reversal. [Neutral]
- Bollinger Bands (20): The upper band is $116.81 and the lower is $37.23, which puts the midline near $77. Price is in the lower half of an extremely wide band, after tagging or breaking the lower band at $40.87 on Nov 5. The wide bands reflect very high volatility, and the midline is a sizable overhead hurdle. [Bearish]
- CMF (20): -0.160, well below the -0.05 threshold. It has been persistently negative, with a trough of -0.328 on Nov 5, and is only partially recovered. Selling pressure still dominates. [Distribution]
- ADX (14): 34.1 and rising from 27 to 34 over the last two weeks, with -DI at 37.9 above +DI at 18.6. This is a strong, established downtrend with bears firmly in control. +DI has been wide of -DI for weeks. [Strong Trend – Bearish]
- Volume: 207.82M, far above the earlier-year baseline. Heavy volume came on the capitulation drop and the bounce has stayed elevated. This signals active repositioning, but the volume surge came on the way down, which confirms distribution. [Bearish – elevated volume confirming the downtrend]
DIVERGENCES & TRENDS
- Moving averages: The death cross is already in place. SMA50D ($110.38) is below SMA200D ($124.01), and EMA50 ($101.26) crossed below EMA200 ($113.26) around Nov 3. Price sits below every moving average and below VWAP ($94.21). This is a confirmed long-term downtrend.
- MACD vs price: The MACD line has been sliding since early September and made new lows (-19.3) on Nov 9. It has since flattened and crossed marginally above the signal. This is a slight momentum improvement but nowhere near a bullish divergence.
- RSI: The RSI low of 26.2 at the $40.87 price low was followed by a higher RSI low of 31.6-34 area retests only in a bounce, not a confirmed higher low on price. There is no clean bullish divergence yet.
- ADX/DI: ADX is rising with -DI dominant, which means the trend is accelerating rather than exhausting. +DI is slightly rolling over again from 21.2 to 18.6.
- CMF: It made a lower low in early November and has not recovered above -0.15. Money flow is confirming the price weakness.
CHART PATTERNS
- Bearish Flag / Pennant (continuation): After the vertical drop from about $107 to $41, price rebounded to roughly $66 and is now pulling back. This looks like a flag or relief-rally structure inside a larger downtrend. A break below roughly $56 would project a further measured move down toward the low $40s or below.
- Possible Bullish Double Bottom (low probability): The Nov 5 low of $40.87 and the Nov 6 close of $45.97 are the base of a potential reversal. It needs a decisive close above $66.03 to confirm, with a first target around $77 (the Bollinger midline) and then the $94 VWAP area.
- Broader context: The multi-month peak-and-decline (a large top near $300 followed by a lower high near $170 and a collapse) fits a major reversal or head-and-shoulders-type distribution. The structure favors lower highs.
- Leveraged ETF decay: SOXL is a 3x leveraged ETF, so extreme volatility and decay in choppy markets add a downward drift. This is consistent with an ATR of $12.84, about 22% of price.
POTENTIAL SCENARIOS
- Scenario 1: Bearish Flag Breakdown — The relief bounce fails under the $66 high, and sellers push price through the recent consolidation low, with the strong ADX and -DI dominance continuing. Trigger: daily close below $56.00. Target: $45.00-$48.00 first, then a retest of $40.87. Invalidation: daily close above $66.03. (50% probability)
- Scenario 2: Bullish Relief Rally / Double Bottom — The MACD cross builds, RSI recovers above 50 and price reclaims the prior swing high, squeezing shorts toward the Bollinger midline. Trigger: close above $66.03 on rising volume. Target: $77.00, with an extension to $85.00. Invalidation: close below $45.97. (32% probability)
- Scenario 3: Neutral Choppy Basing Range — Price oscillates between the November low zone and the recent bounce high as volatility compresses. Trigger: holds between $48 and $66 with ADX fading below 25. Target: $52-$62. Invalidation: close outside $45-$68. (18% probability)
PRICE TARGETS
- Target Price: $52.00 (83-day horizon, Feb 6, 2027)
- Expected Range: $43.50 to $61.00. The width is $17.50, or 30% of the $58.32 price, which is at the top of the 61-180 day guidance because ATR is very high.
- Key Levels: Support at $40.87, Resistance at $66.03. A minor support sits at $56.06 and further resistance at $77.00.
OVERALL BIAS
OVERALL BIAS: BEARISH - Price is below all key moving averages and VWAP, with a death cross in place, ADX at 34 with -DI far above +DI, and CMF showing distribution. The marginal MACD cross and the oversold bounce are not enough to override the downtrend, though high volatility leaves room for sharp relief rallies.
This is educational analysis and not financial advice.