SOXL 48-day bearish forecast — Nov 15, 2026
- Bias: Bearish
- Timeframe: 48 days (made Nov 15, 2026, target date Jan 1, 2027)
- Price at analysis: $58.32
- Price target: $52.50
- Expected range: $47.50 – $58.00
- Result: Pending — graded after the close on Jan 1, 2027
Get a free AI analysis of SOXL today
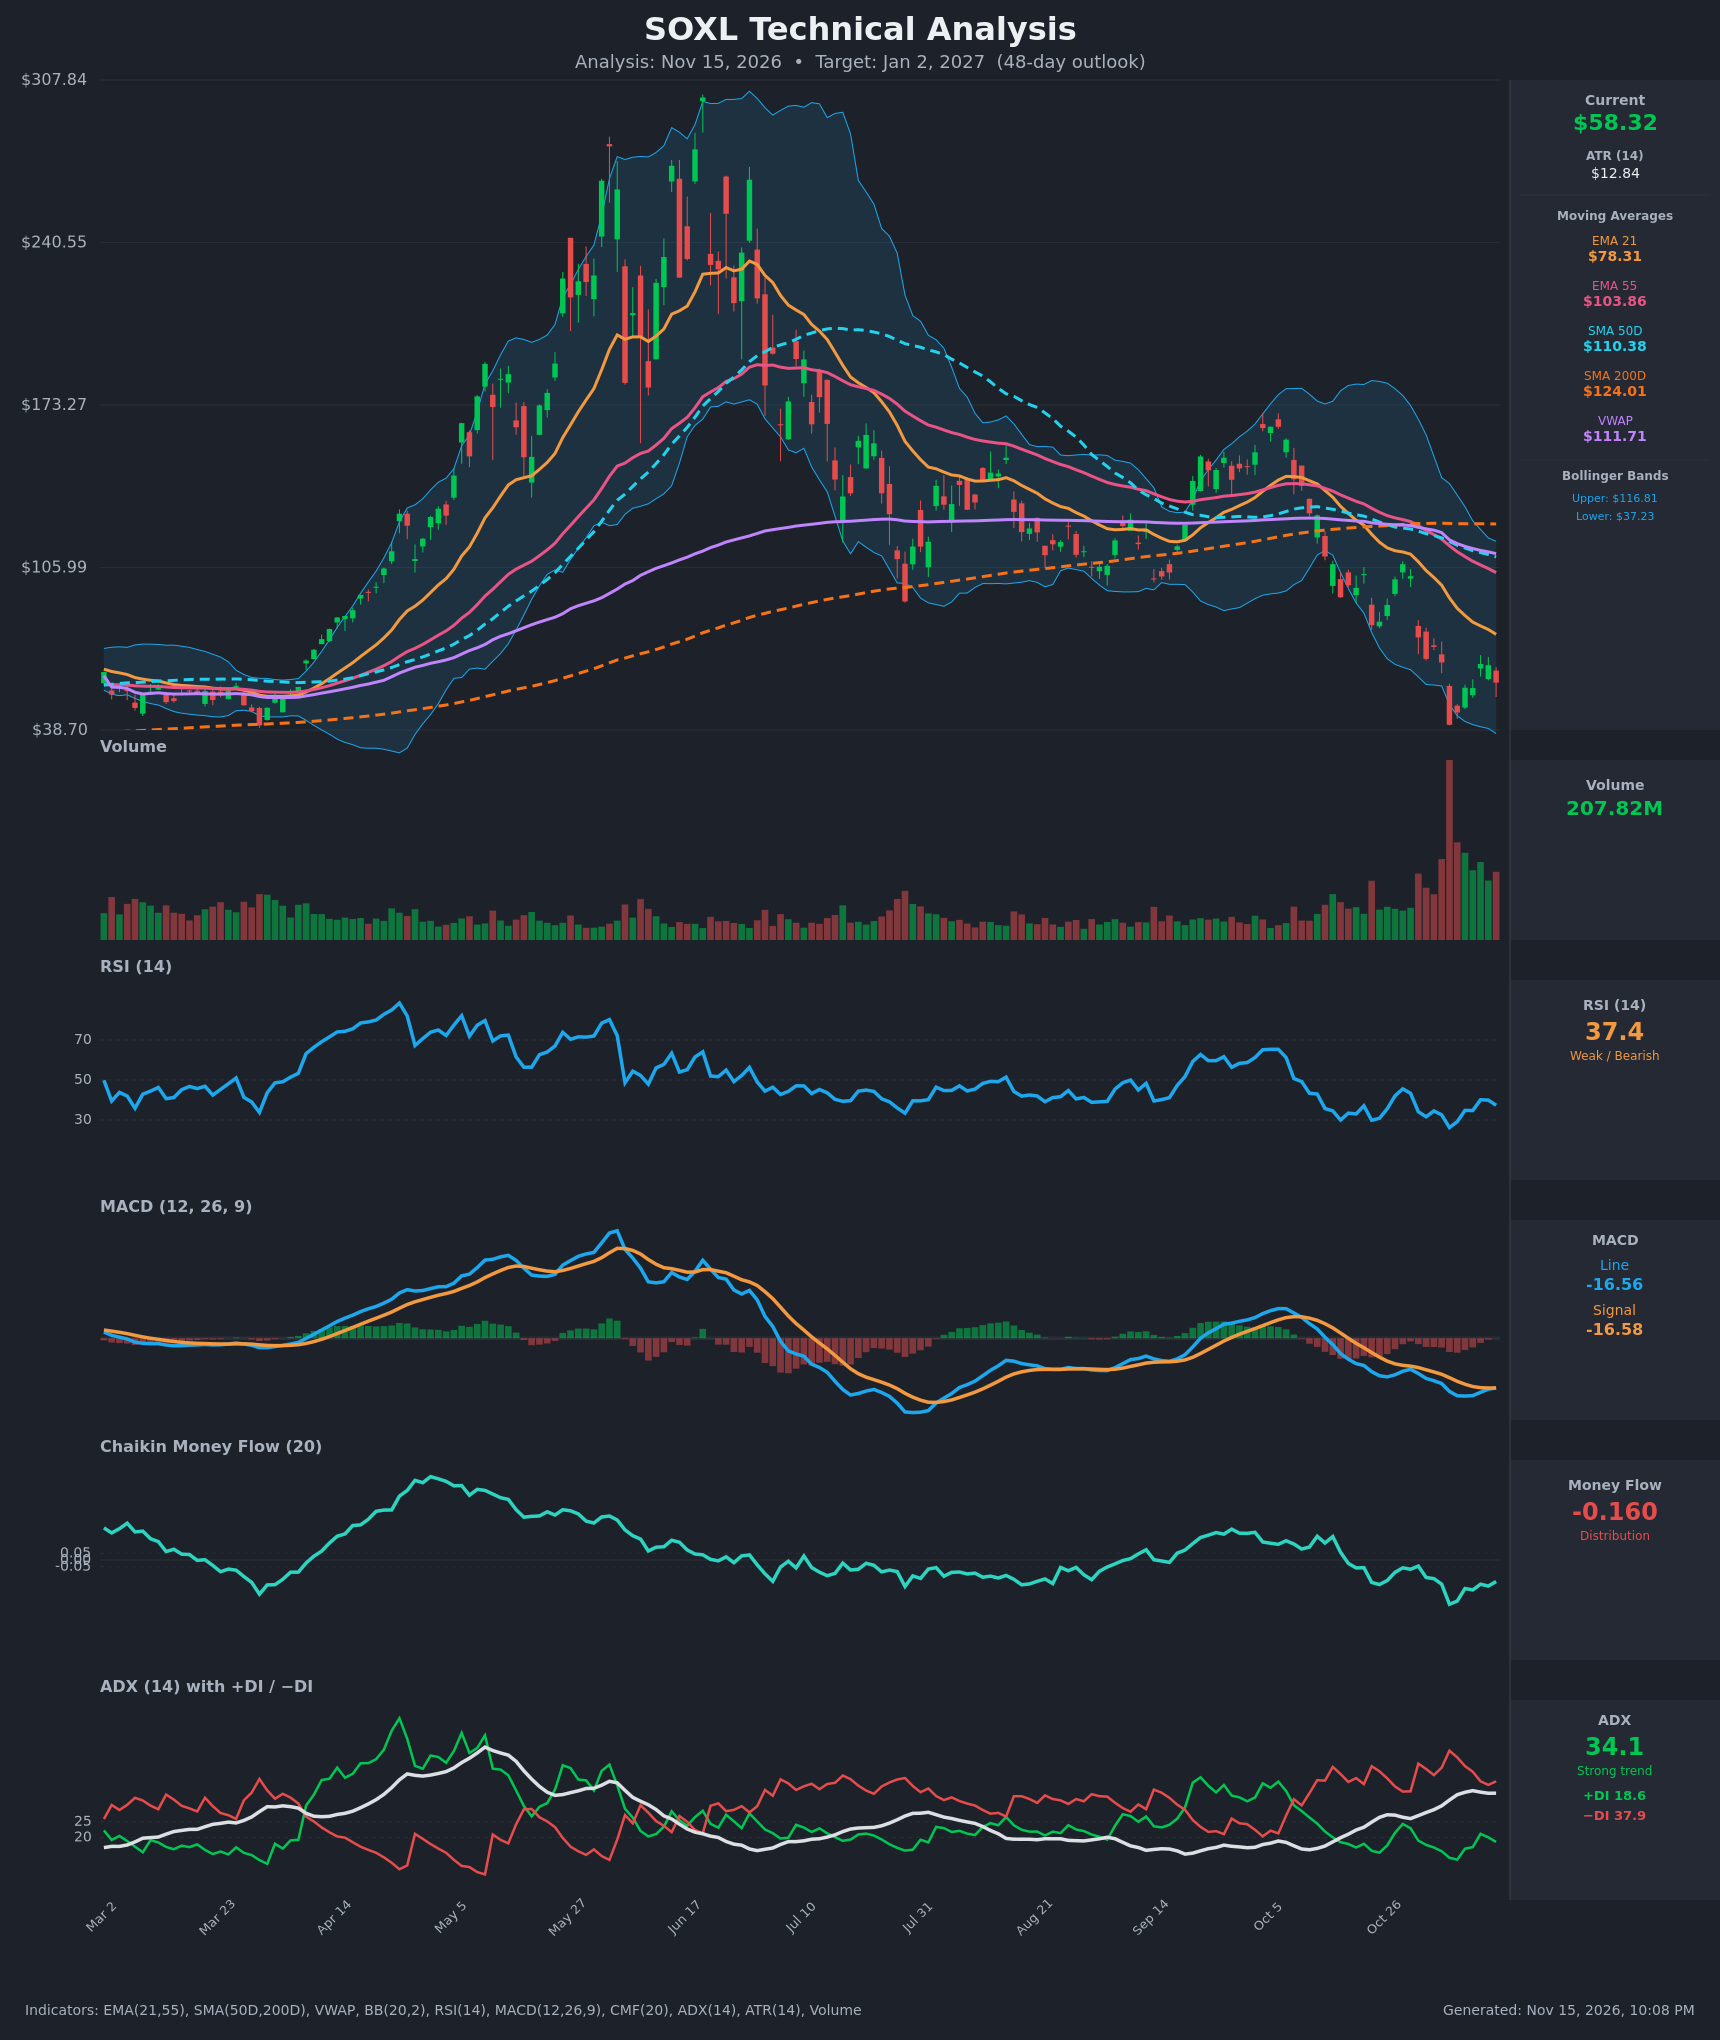
Analysis
TECHNICAL INDICATORS
- RSI (14): 37.37, down from 40.1 on Nov 11 after bouncing off 26.2 on Nov 5. It sits below 50 and above the 30 oversold line, so there is room to fall further, and the bounce has stalled at the 40 area. [Bearish]
- 20 EMA (EMA 21): $78.31, about 34% above price and falling steeply (from $114 on Oct 26). EMA21 is also below EMA55 ($103.86), a standing bearish crossover. The EMA21 is overhead resistance. [Bearish]
- MACD: Line -16.558 vs signal -16.582, a marginal bullish crossover with the histogram barely positive. Both lines are deeply negative, so this reflects slowing downside momentum, not a trend reversal. [Neutral]
- Bollinger Bands (20): Upper $116.81, lower $37.23, with the midline near $77. Price at $58.32 sits in the lower half after touching or breaching the lower band on Nov 5 ($40.87 close). The bands are very wide, showing extreme volatility. The failed bounce below the midline favors continued weakness. [Bearish]
- CMF (20): -0.160, well below -0.05. It has been negative for months and hit -0.328 on Nov 5, with only a modest recovery. Sellers still dominate. [Distribution]
- ADX (14): 34.1 and rising from ~26, with −DI (37.9) well above +DI (18.6). This is a strong, established downtrend. +DI has not crossed back above −DI. [Strong Trend – Bearish]
- Volume: 207.82M, with a huge capitulation-style spike on the Nov 5 breakdown and persistently elevated volume since. Selling pressure is heavy, but a volume climax can also mark a short-term low and a bounce. [Bearish with capitulation risk]
Other levels and moving averages:
- Price is far below SMA200D ($124.01), SMA50D ($110.38) and VWAP ($111.71).
- SMA50D is below SMA200D, a death cross.
DIVERGENCES & TRENDS
- Momentum divergence: Price made a new low on Nov 5 ($40.87) and bounced, but the later pullback to $58.32 came with MACD flattening. MACD is not making new lows, which hints at slowing downside momentum. This is a mild bullish divergence in the short term and has not been confirmed by a price breakout.
- RSI: It made a lower high on the bounce (40.1 vs 45.6 on Oct 28) and is rolling over again. This is bearish.
- Trend structure: Price has made lower highs since the June peak (~$300 down to ~$165 in Sep, then ~$110), and every rally has failed at or below the EMA21/EMA55.
- Crossovers: EMA21 is below EMA55, and the death cross is in place. The MACD line has just crossed marginally above the signal line, a weak signal.
- CMF and ADX: CMF stays deeply negative. ADX is rising with −DI dominant, confirming trend strength.
CHART PATTERNS
- Bearish Flag / Rising Wedge-type bounce (continuation): After the sharp drop to $40.87, the rebound to ~$66 is a counter-trend retracement (about a third of the prior decline from ~$107 to $41). A rollover from here suggests the flag is resolving down. A measured move of the prior leg would point well below $40, though a 48-day target should be more conservative given volatility.
- Larger structure: The June blow-off top, the lower high in September and the break below the SMA200D resemble a multi-month Head and Shoulders-type reversal. The downside is already well advanced.
- Counter-scenario: A Bullish Double Bottom is possible if price retests the $41–46 zone and holds, with a neckline around $66.
POTENTIAL SCENARIOS
- Scenario 1: Bearish Trend Continuation — Price fails below the $66 resistance, the bounce rolls over, and sellers (−DI > +DI, CMF negative) push price back to retest the Nov 5 low zone. Trigger: close below ~$56 (recent bounce base) on rising volume. Target: $45–$50, with possible extension to $41. Invalidation: daily close above $66.03. (50% probability)
- Scenario 2: Bullish Relief Rally — The capitulation volume and MACD bullish cross spark a short-covering bounce toward the declining EMA21. Trigger: close above $66 with +DI crossing above −DI. Target: $75–$78 (EMA21), which would still be resistance. Invalidation: close below $45.97. (30% probability)
- Scenario 3: Neutral Consolidation — Price chops between roughly $45 and $66 as volatility compresses after the spike. Trigger: ADX rolling over below 30 with price pinned mid-range. Target: $52–$62. Invalidation: close outside the $45–$66 range. (20% probability)
PRICE TARGETS
For the 48-day timeframe (Jan 2, 2027). ATR is very high at 22% of price, so the realized range could be wider than the guide, but the range is kept near the 12–18% band for 30–60 days.
- Target Price: $52.50 (about 10% below current)
- Expected Range: $47.50 to $58.00 (width $10.50, about 18% of current price)
- Key Levels: Support at $45.97, Resistance at $66.03
OVERALL BIAS
OVERALL BIAS: BEARISH - Price is below every moving average with a death cross, strong ADX (34.1) with −DI dominant, CMF at -0.16 showing distribution, and a failed rebound near $66. MACD flattening and capitulation volume raise the odds of a relief bounce, but the trend favors lower prices.
This is educational analysis and not financial advice.