SOXL 4-day bearish forecast — Oct 31, 2026
- Bias: Bearish
- Timeframe: 4 days (made Oct 31, 2026, target date Nov 3, 2026)
- Price at analysis: $77.07
- Price target: $75.00
- Expected range: $72.00 – $79.00
- Result: Correct (-5.1%) — closed at $73.12 on Nov 3, 2026; quality score 96/100
Get a free AI analysis of SOXL today
Analysis
TECHNICAL INDICATORS
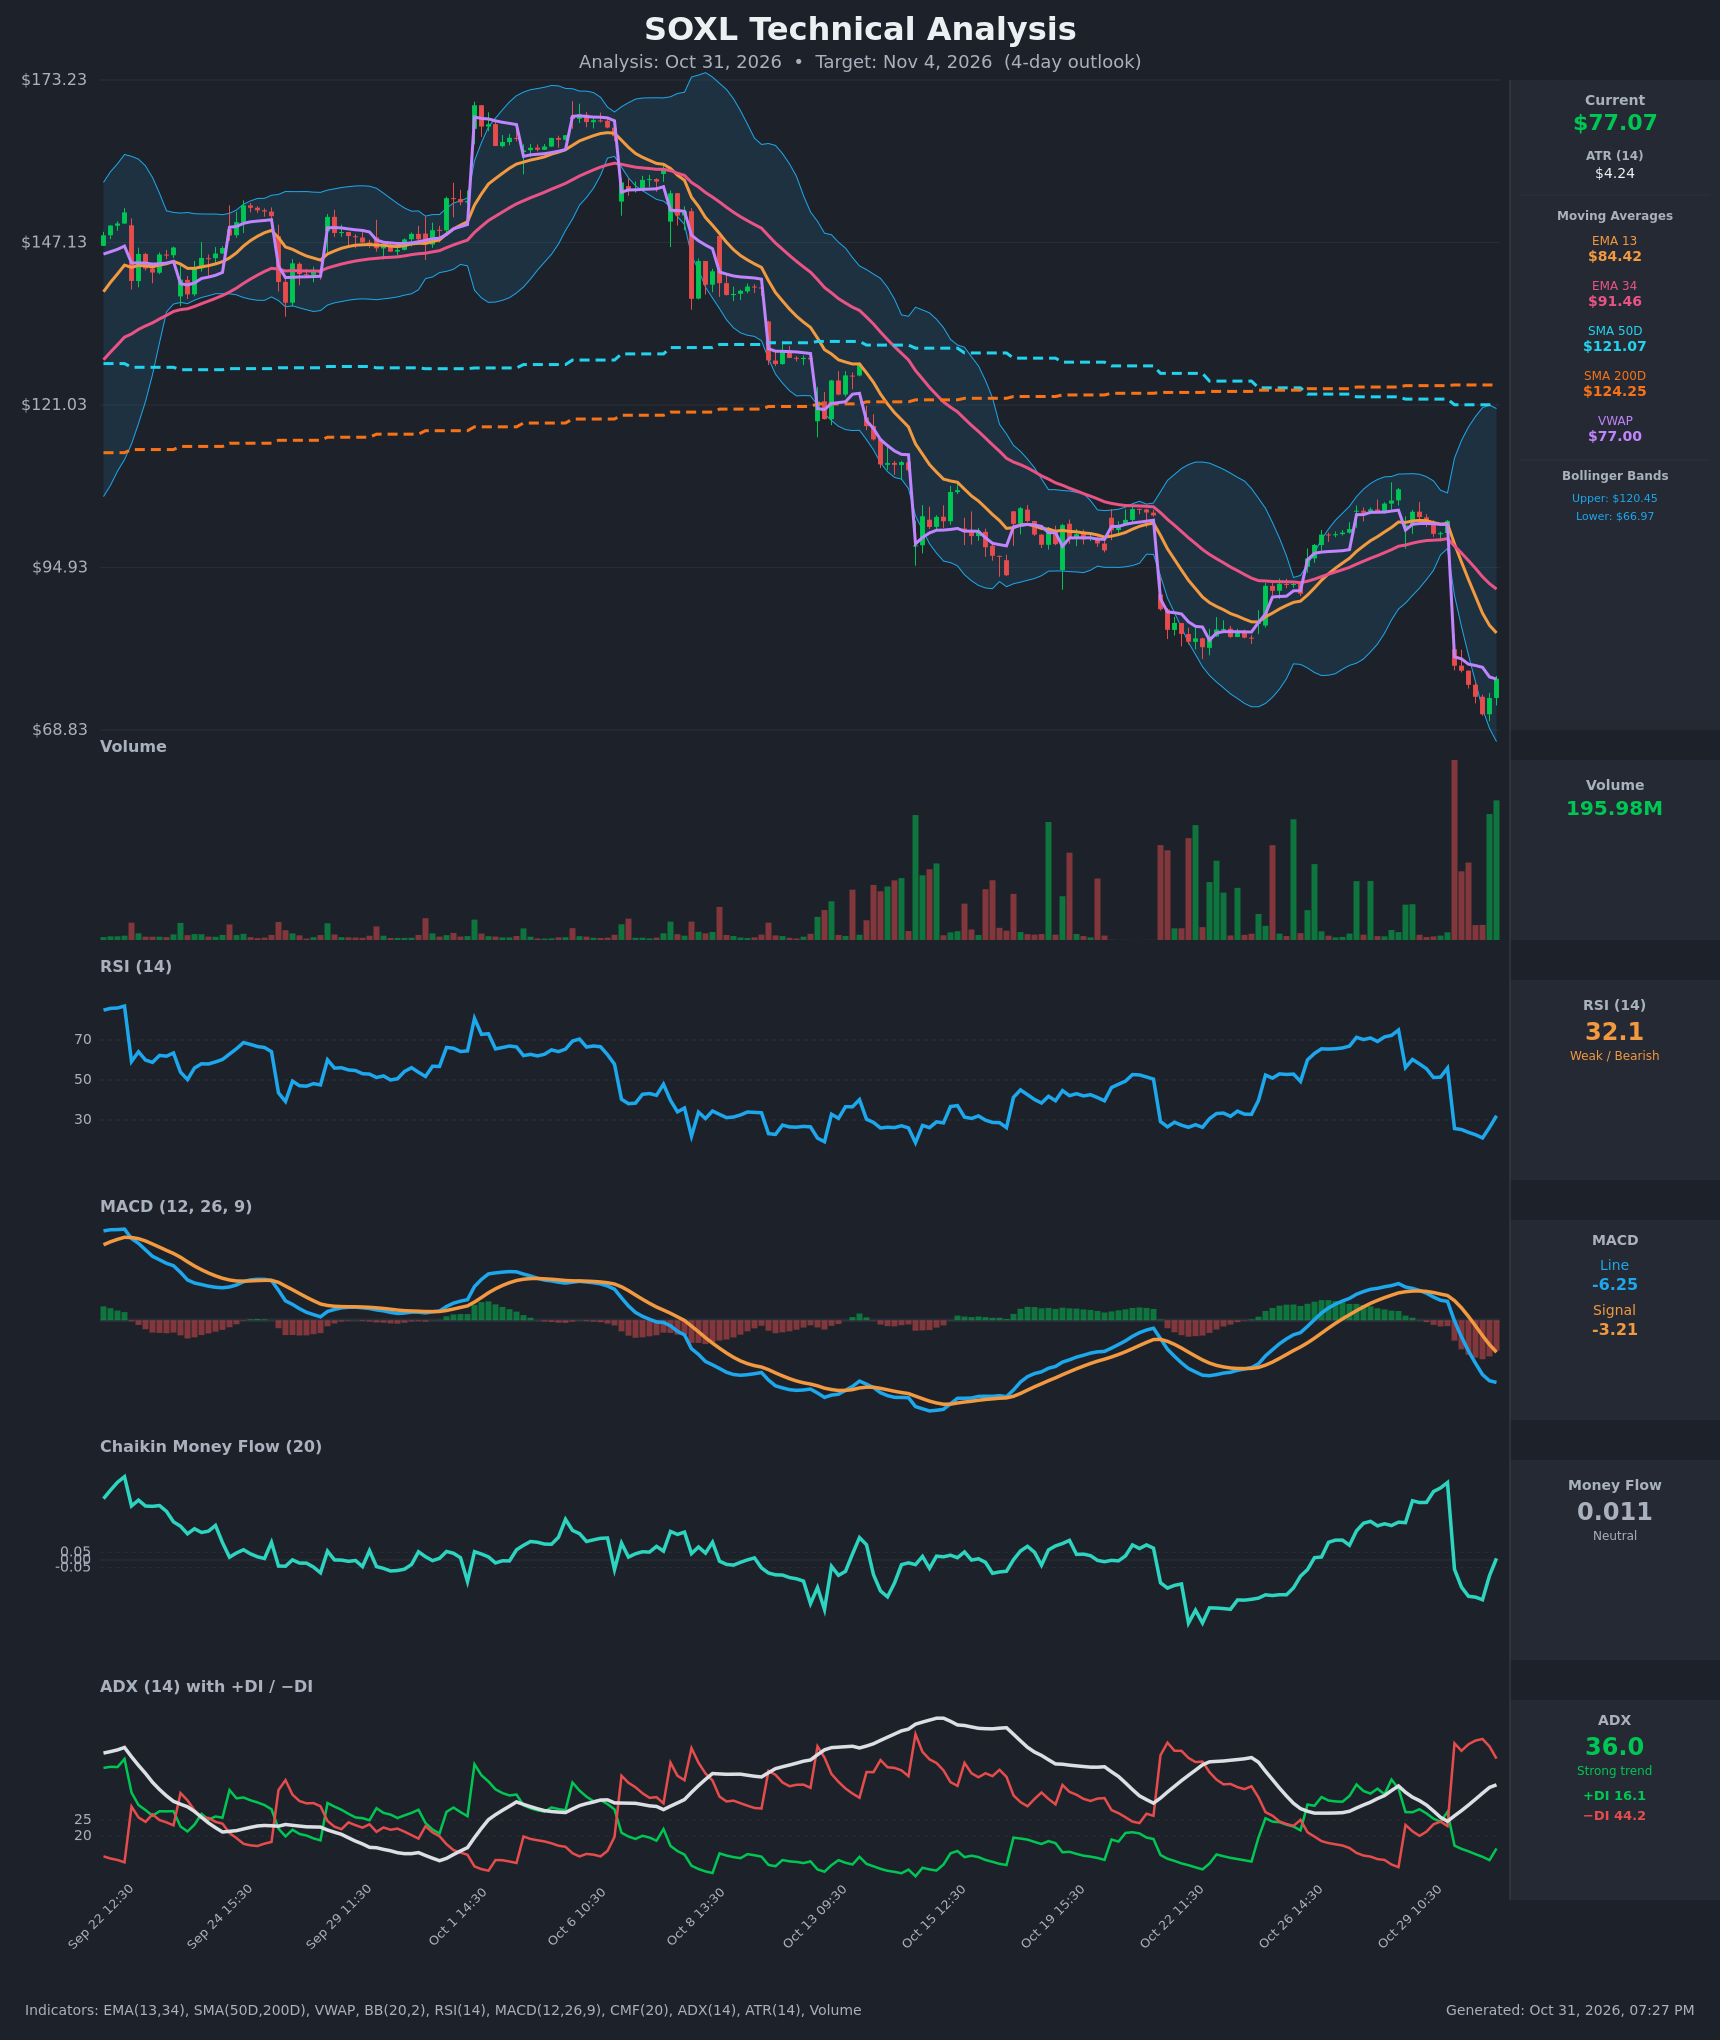
- RSI (14): 32.12, bouncing from a low of about 21 (Oct 30 13:30) but still below 40 and under the 50 midline. It has just exited deep oversold, which favors a relief bounce, but it shows no trend change yet. [Bearish]
- 20 EMA (EMA 13 / EMA 34 used): EMA13 is $84.42 and EMA34 is $91.46, both well above the $77.07 price. EMA13 is below EMA34 and the gap is widening. The EMAs now act as overhead resistance, with the first one about 9.5% above price. [Bearish]
- MACD: The line is -6.25 and the signal is -3.21. The bearish crossover happened on Oct 30 around 12:30, and the histogram is deeply negative at about -3.0. The line is still falling away from the signal, so downside momentum has not yet turned. [Bearish]
- Bollinger Bands (20): Upper is $120.45 and lower is $66.97. The bands are very wide after the gap, and price sits in the lower third, about $10 above the lower band. The bar low near $71 approached the lower band, and the first bounce is underway. There is no band squeeze, so volatility is elevated. [Neutral]
- CMF (20): 0.011, inside the ±0.05 neutral zone. It dipped to -0.26 and has recovered quickly, which suggests selling pressure is easing. It is not yet accumulation. [Neutral]
- ADX (14): 36.0 and rising, with −DI (44.2) far above +DI (16.1). This is a strong, established downtrend with bears firmly in control, although the DI spread is narrowing slightly on the last bar. [Strong Trend – Bearish]
- Volume: 195.98M, with elevated, heavy volume on the gap-down and the last bars. The big red volume on the breakdown shows real distribution. The latest green bar on high volume hints at dip-buying or capitulation. [Heavy selling, early bounce attempt]
Other context:
- VWAP ($77.00): Price is exactly at VWAP, so it is a pivot level.
- SMA50D ($121.07) / SMA200D ($124.25): Price is far below both. The 50D is below the 200D, so the death-cross structure is intact (long-term downtrend).
DIVERGENCES & TRENDS
- There is no confirmed bullish RSI divergence. RSI made its low (21) as price made its low ($71.36), then both bounced together.
- RSI and CMF are turning up from extremes while MACD and ADX still point down. This is a typical short-term relief bounce within a larger downtrend.
- The trend structure is a series of lower highs and lower lows: $173 → $147 → ~$100 → ~$77, a cascade of gap-downs. The latest gap from $102 to $79 is a major break below the prior $90–$100 support base.
- Price is below EMA13, EMA34, SMA50D and SMA200D, with the EMA13/34 and 50/200 stack bearish.
- The MACD bearish crossover is fresh and the histogram is expanding negatively.
- ADX is rising from the mid-20s to 36 with −DI dominant, which confirms trend strength.
CHART PATTERNS
- The dominant pattern is a sharp Bearish Flag / Pennant-type continuation setup. After the gap-down, a small bounce from $71.36 to $77 could be forming a flag. A rejection near $79–$84 would favor a measured move lower.
- No clear reversal pattern is complete. A bullish double bottom or falling wedge would need a retest of $71–$72 that holds, plus a break above about $80. That is not present yet.
- The measured-move target for a flag break below $71.36 points toward the lower Bollinger Band area near $67, and then $62–$65.
- The gap-fill zone ($79–$84, near EMA13) is the key resistance area for any bounce.
POTENTIAL SCENARIOS
- Scenario 1: Bearish Trend Continuation — The relief bounce fades near VWAP or the gap-open area, and sellers re-assert with −DI dominant and MACD still falling. Trigger: rejection at $79–$80 or a break below $74. Target: $72–$73 first, then a retest of $71.36 and the lower band near $67. Invalidation: a daily close above $84.42 (EMA13). (50% probability)
- Scenario 2: Bullish Oversold Relief Bounce — RSI recovery and improving CMF extend into a bounce toward the gap and EMA13 zone. Trigger: a hold above VWAP ($77.00) and a break above $79.14. Target: $82–$84.40. Invalidation: a break below $73.50. (35% probability)
- Scenario 3: Neutral Consolidation — Price stabilizes after the shock and chops between $73 and $79 as volatility cools. Trigger: failure to break either $71.36 or $79.14. Target: $75–$78. Invalidation: a decisive close outside $71–$80. (15% probability)
PRICE TARGETS
- Target Price: $75.00 (4-day horizon)
- Expected Range: $72.00 to $79.00 (width $7.00, about 9.1% of current price; this is on the wide side of typical 4-day guidance because ATR is elevated at $4.24 after the gap)
- Key Levels: Support at $71.36, Resistance at $79.14
OVERALL BIAS
OVERALL BIAS: BEARISH - Price is below all key moving averages with a strong ADX (36) and −DI dominating. The MACD bearish crossover is still widening and the death-cross structure is intact. The oversold bounce (RSI 32, CMF recovering) is likely to meet resistance at VWAP and the $79–$84 gap zone, but conviction is modest because of the bounce risk.
This is educational analysis and not financial advice.