NVDA 4-day bearish forecast — Oct 31, 2026
- Bias: Bearish
- Timeframe: 4 days (made Oct 31, 2026, target date Nov 3, 2026)
- Price at analysis: $204.81
- Price target: $202.80
- Expected range: $198.50 – $207.50
- Result: Incorrect (+0.9%) — closed at $206.69 on Nov 3, 2026; quality score 50/100
Get a free AI analysis of NVDA today
Analysis
TECHNICAL INDICATORS
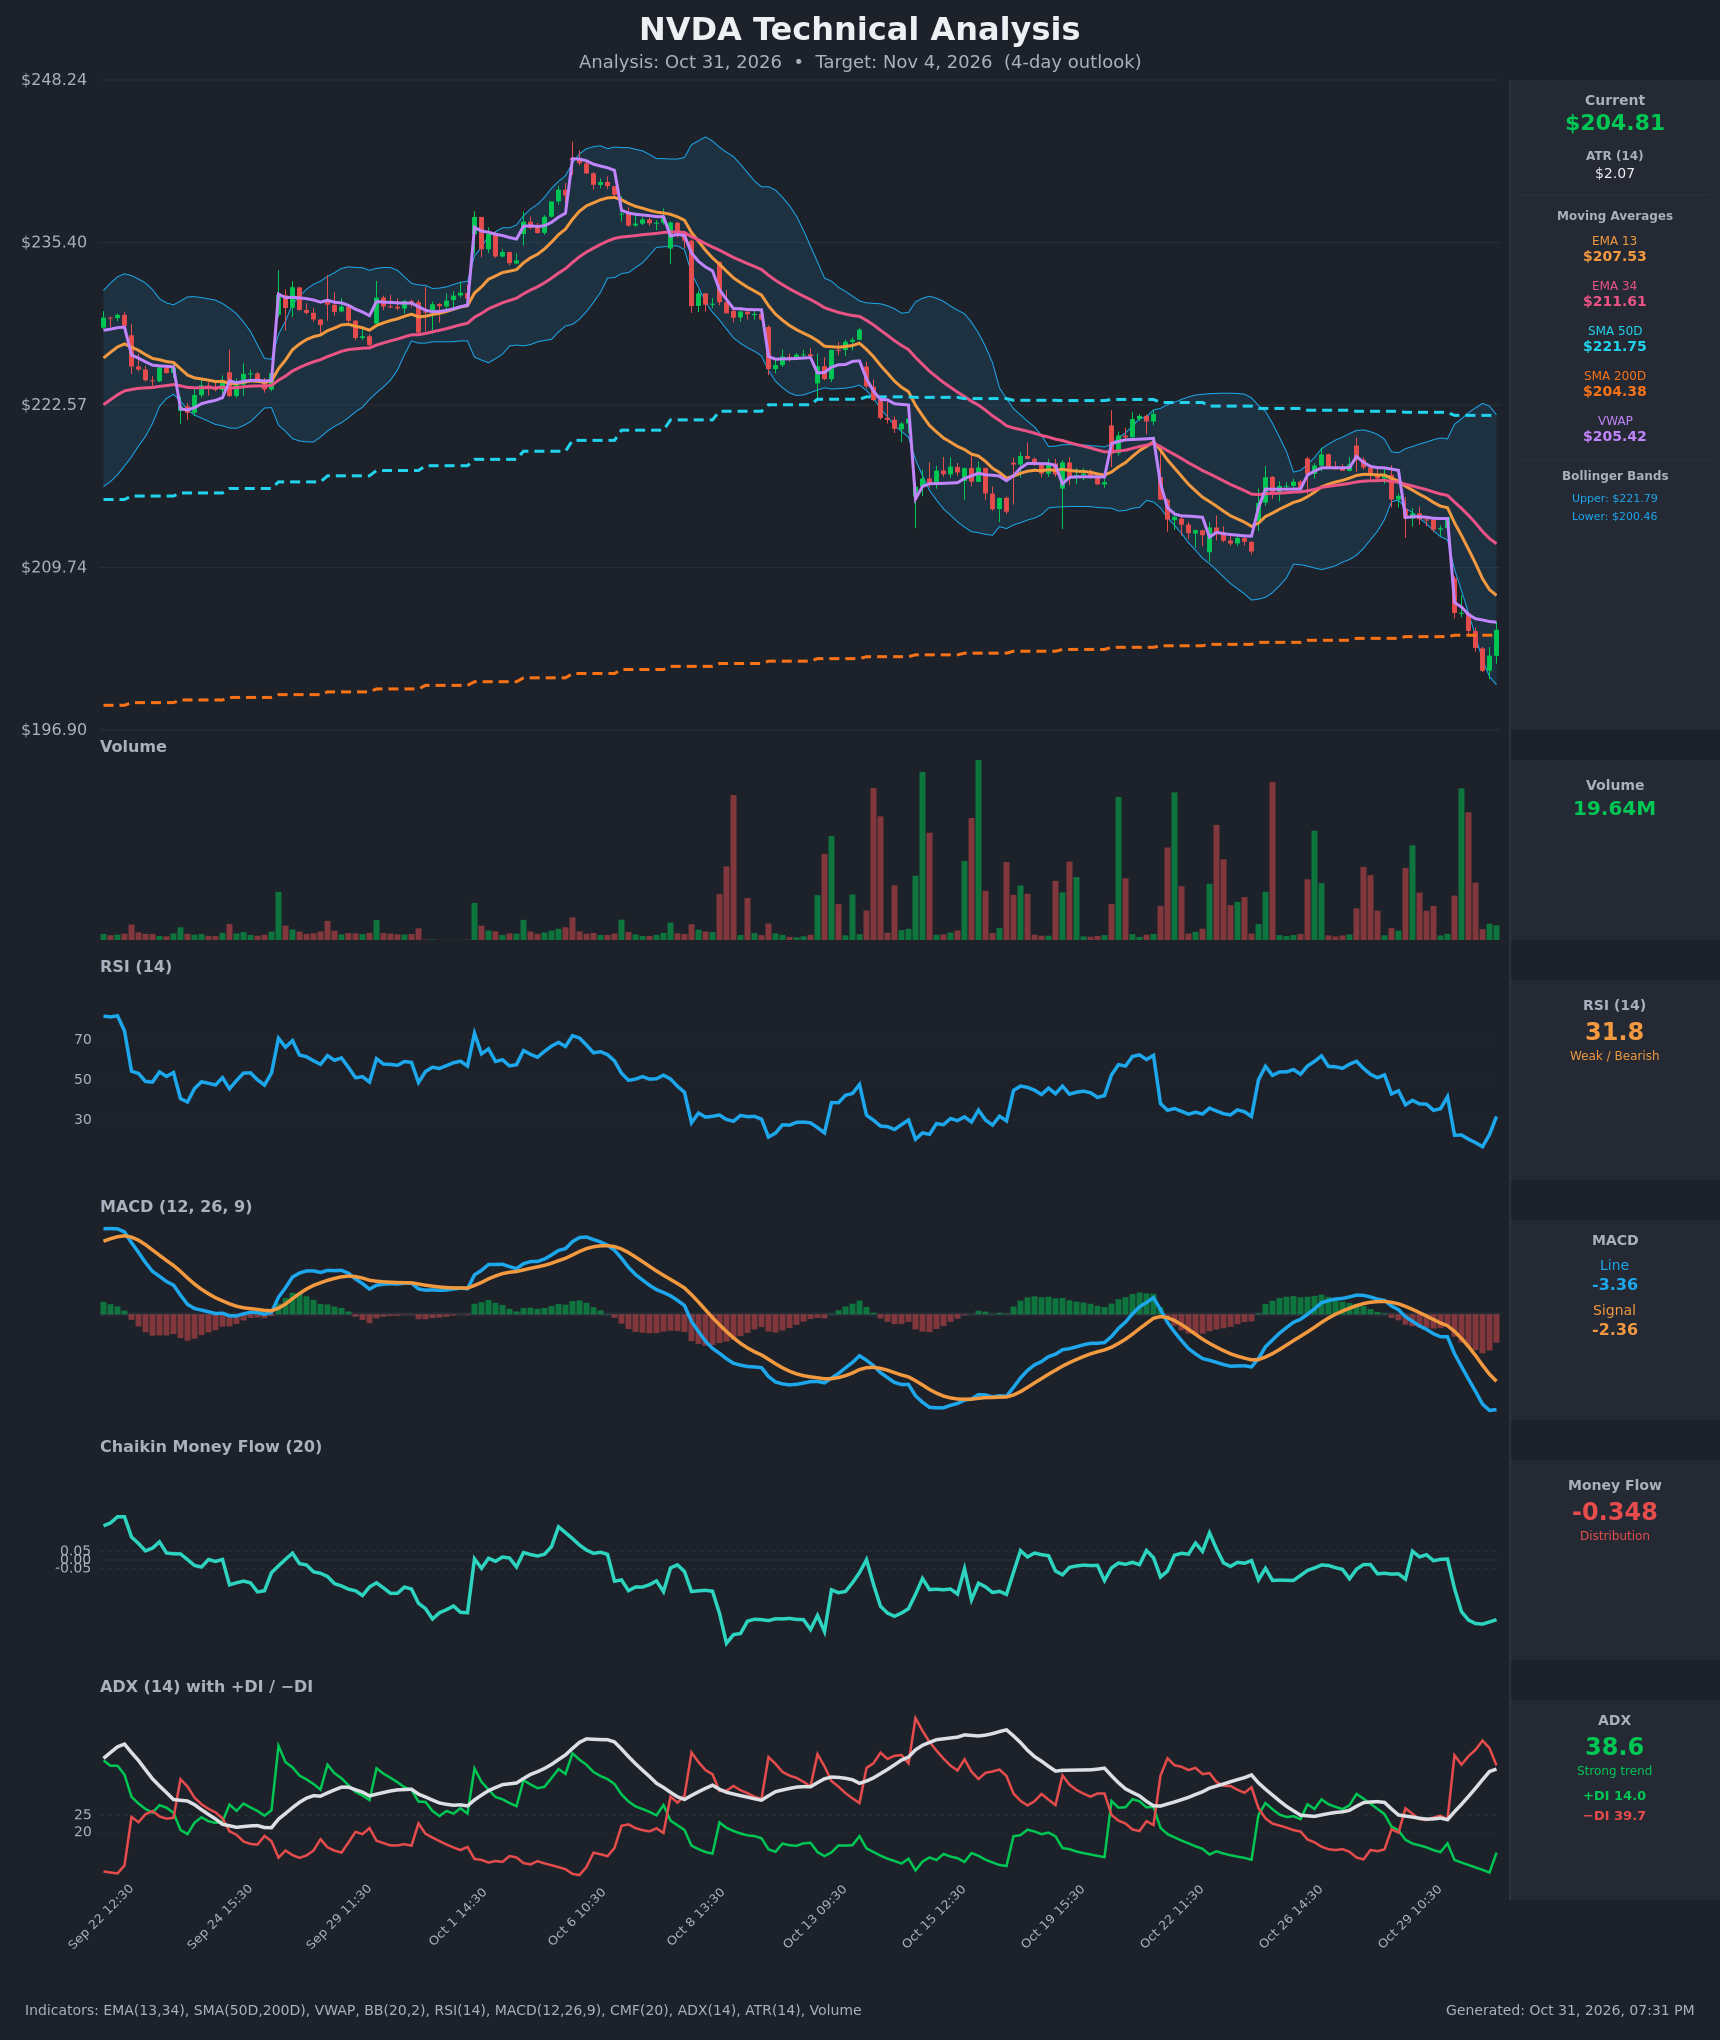
- RSI (14): 31.77, bouncing from an extreme 16.6 on Oct 30 13:30 but still below 40. The bounce is an oversold relief, not a momentum reversal. [Bearish]
- 20 EMA: The supplied values are EMA 13 at $207.53 and EMA 34 at $211.61. Price at $204.81 is below both, and both are sloping down with EMA13 under EMA34 (a bearish crossover that happened days ago). The EMAs are overhead resistance. [Bearish]
- MACD: The line at -3.36 is below the signal at -2.36, with a widening negative histogram. The line ticked up slightly from -3.39 on the last bar, but there is no bullish crossover. [Bearish]
- Bollinger Bands (20): Upper $221.79, lower $200.46. Price is in the lower quarter of the bands after riding the lower band during the Oct 30 selloff. The bands are wide, which shows expanded volatility. A "band walk" like this tends to continue unless price closes back above the midline. [Bearish]
- CMF (20): -0.348, deep distribution, well below -0.05. It has been negative since the gap-down and has barely improved on the bounce. [Distribution]
- ADX (14): 38.6 and rising, with −DI at 39.7 far above +DI at 14.0. This is a strong, established downtrend. +DI is ticking up from 8.1, which signals only a mild relief bounce. [Strong Trend – Bearish]
- Volume: 19.64M on the latest bar. Volume was heavy on the gap-down, and the bounce bars are lighter, which suggests weak buying conviction. The price is also near the SMA200D ($204.38) and VWAP ($205.42), which are the key local decision points. [Bearish-leaning / Weak bounce]
DIVERGENCES & TRENDS
- Divergences: No clear bullish divergence on the higher timeframe. The RSI low (16.6) matches the price low, and MACD is still making lower lows. On the hourly data, RSI is recovering faster than price, which points to a short-term relief bounce rather than a trend change.
- Trend: The lower-highs, lower-lows structure from the Oct 6 peak (~$240) is intact. EMA13 is below EMA34, and EMA34 is below SMA50D ($221.75). Price has now broken below the SMA50D and is testing the SMA200D ($204.38). SMA50D is still above SMA200D, so there is no death cross yet, but the gap is narrowing.
- Crossovers and breaks:
- The MACD bearish crossover occurred on Oct 29 12:30.
- The −DI crossover on Oct 29 flipped control to the bears.
- The Oct 30 open gapped down from $213.72 to $206.14 and broke below the lower band.
- Price is now sitting right on the SMA200D, which is the last major long-term support.
CHART PATTERNS
- Bearish Head and Shoulders (loose, Reversal): The Oct 6 peak (~$240) with lower shoulders on either side, a neckline break near $215–$217, and a measured move toward the low $200s. Price is arriving at that target zone, so downside from the pattern is largely played out.
- Descending channel / lower-high sequence: Each bounce has failed at the declining EMA13/EMA34, which is classic bearish continuation behavior.
- Possible Bullish Falling Wedge (unconfirmed): The compression into the SMA200D and lower band could become a falling wedge, but it needs a reclaim of $207.5–$211 on strong volume first. This is a lower-probability alternative.
- Significance: The SMA200D at $204.38 is the key pivot. A decisive close below it opens $200.46 (the lower band) and then roughly $196–$197 (the bottom of the chart range).
POTENTIAL SCENARIOS
- Scenario 1: Bearish Trend Continuation — Price fails at VWAP/EMA13 resistance and rolls over, breaking below the SMA200D with ADX still above 35 and −DI dominant. Trigger: close below $204.38 and then below $202. Target: $200.46 first, then about $198. Invalidation: a close above $208 (EMA13) on rising volume. (50% probability)
- Scenario 2: Bullish Oversold Relief Bounce — The SMA200D holds and the oversold RSI/lower band drive a mean-reversion bounce toward VWAP and the EMAs. Trigger: hold above $204.38 and reclaim of $205.42 VWAP with a rising MACD histogram. Target: $207.50 (EMA13), possibly $211.60 (EMA34). Invalidation: a break below $202.50. (35% probability)
- Scenario 3: Neutral Chop Around the SMA200D — Price consolidates between $202 and $207 as the bulls and bears fight over the SMA200D and VWAP. Trigger: failure to break either $202 or $207.5. Target: about $204–$205. Invalidation: a close outside the $200.5–$208 range. (15% probability)
PRICE TARGETS
For the 4-day horizon, the range is about 4.4% of the current price: $9.00 width / $204.81 = 4.4%, which fits the 2–4% and 4–8% bands for 2–3 and 7–10 days.
- Target Price: $202.80 (4 days)
- Expected Range: $198.50 to $207.50
- Key Levels: Support at $200.46 (lower Bollinger Band), Resistance at $207.53 (EMA13, with VWAP at $205.42 as first resistance)
OVERALL BIAS
OVERALL BIAS: BEARISH - Strong downtrend (ADX 38.6 with −DI 39.7 vs +DI 14.0), a bearish MACD, deep CMF distribution of -0.348 and price below every EMA and VWAP all outweigh the oversold bounce, though the SMA200D and the lower band make a relief rally a meaningful risk, so conviction is moderate.
This is educational analysis and not financial advice.