NVDA 77-day bullish forecast — Nov 17, 2026
- Bias: Bullish
- Timeframe: 77 days (made Nov 17, 2026, target date Feb 1, 2027)
- Price at analysis: $156.14
- Price target: $170.00
- Expected range: $92.00 – $274.00
- Result: Pending — graded after the close on Feb 1, 2027
Get a free AI analysis of NVDA today
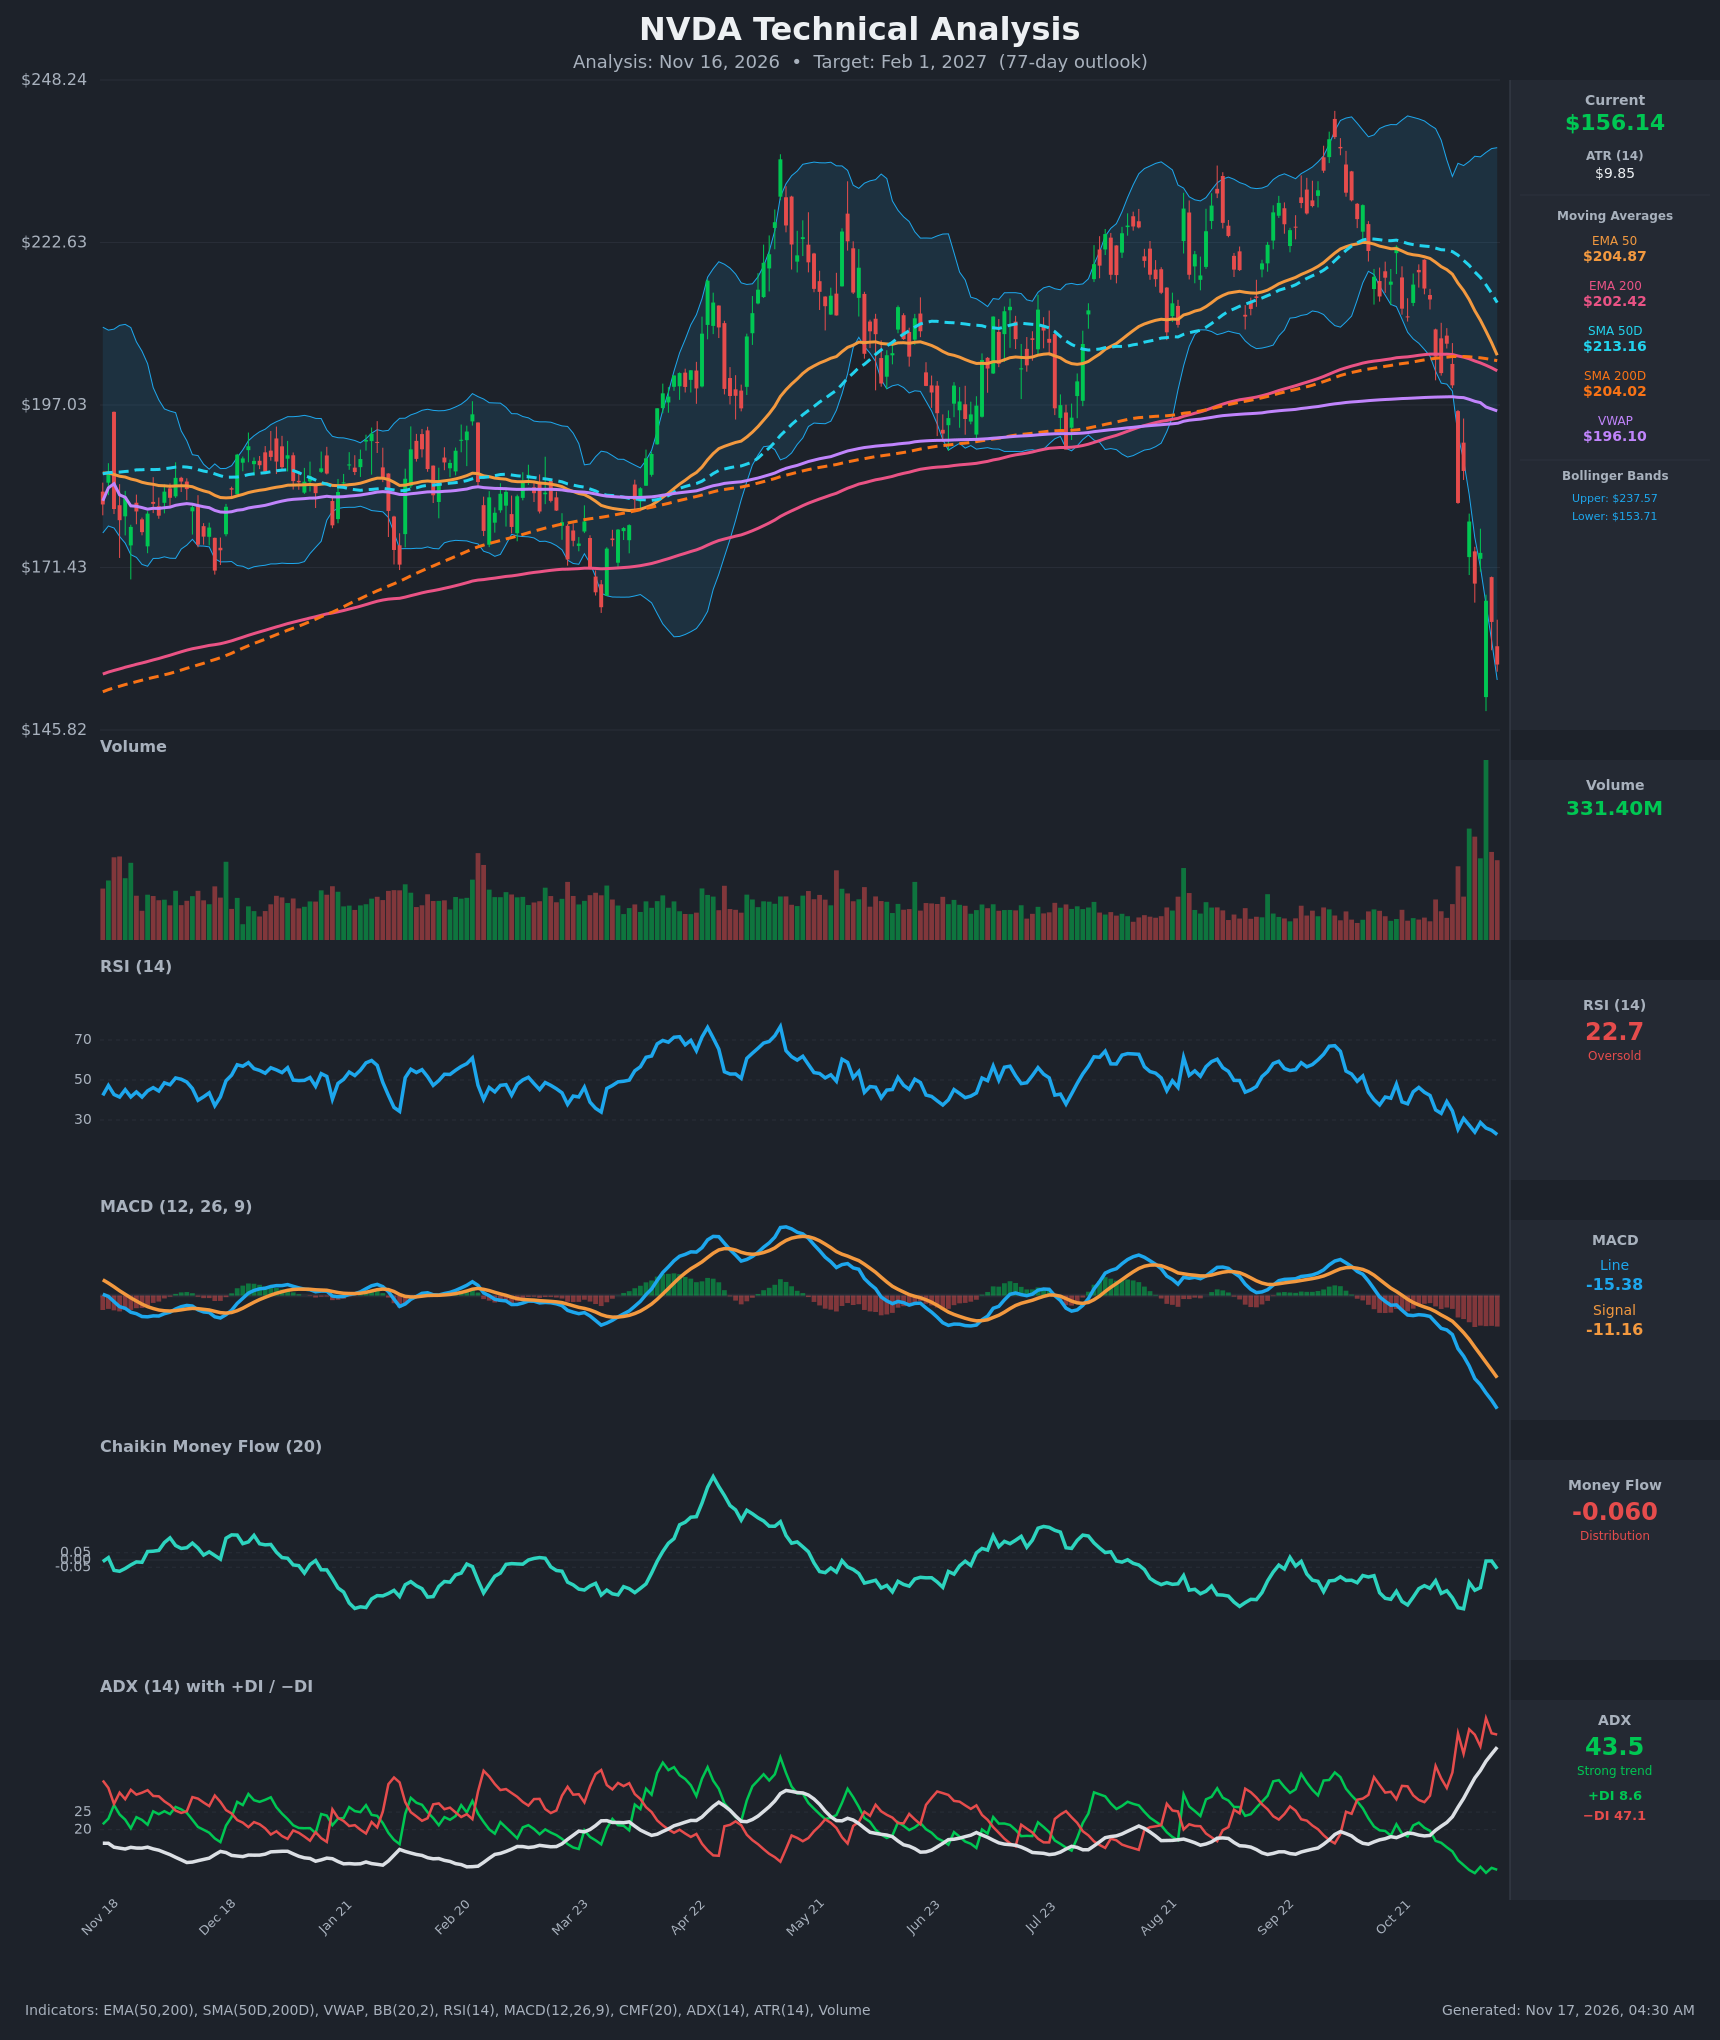
Analysis
TECHNICAL INDICATORS
- RSI (14): 22.72, deeply oversold and at the lowest reading on the chart. It fell from 46 on Oct 27 to under 23 in about 3 weeks, so momentum is still pointing down. Readings this low often come near exhaustion, but RSI can stay pinned below 30 in a strong trend. [Bearish (short-term momentum), with oversold bounce potential]
- Moving Averages: Price ($156.14) is below every average: EMA 50 ($204.87), EMA 200 ($202.42), SMA 50D ($213.16), SMA 200D ($204.02) and VWAP ($196.10). All of them are now overhead resistance, and the nearest sits about 25% above price. EMA 50 is falling fast and only $2.45 above EMA 200, so a bearish EMA crossover is imminent. SMA 50D is still above SMA 200D, but the gap is narrowing quickly (from about $18 to $9 in 15 bars), so a death cross is likely within weeks. [Bearish]
- MACD: The line (-15.38) is below the signal (-11.16) and the histogram is about -4.2 and widening. The bearish crossover happened in late October and the gap has grown every day since. [Bearish]
- Bollinger Bands (20): Price is $156.14, just above the lower band ($153.71) and far below the middle band (about $195.6). The bands are very wide (upper $237.57), which signals a volatility expansion. Price is riding the lower band after a sharp breakdown. This is typically stretched, but it is not yet a confirmed reversal. [Bearish, stretched]
- CMF (20): -0.060, marginally below the -0.05 threshold. It has recovered from the -0.33 low on Nov 6 and was near zero (-0.007) on Nov 12-13, so selling pressure is no longer intensifying. Money flow is still mildly negative. [Distribution (weakening)]
- ADX (14): 43.5 and rising, well above 25, which marks a very strong trend. −DI (47.1) is far above +DI (8.6), so the bears are firmly in control. A trend this strong can persist, but ADX above 40 with −DI above 45 also often appears near trend climaxes. [Strong Trend - Bearish]
- Volume: 331.4M, the largest bar on the chart, with a long lower wick near $146 on the capitulation days. Heavy volume during a steep decline can mark panic selling, which often precedes at least a relief bounce, but it also confirms real distribution. [Capitulation-type volume, ambiguous]
DIVERGENCES & TRENDS
- There is no bullish RSI or MACD divergence yet. RSI (22.7) and MACD (-15.4) are both making new lows with price, so momentum confirms the decline.
- CMF is the one improving indicator. It rose from -0.33 to about -0.06 while price kept falling, a mild positive divergence in money flow.
- All trend gauges are bearish and accelerating: −DI is rising, ADX is rising, and MACD is spreading below its signal line.
- Price fell from about $218 to $156 (roughly -28%) in 15 bars, losing the SMA 200D and EMA 200 support zone (~$202-205) on a high-volume gap-down.
- The next crossovers are an EMA 50 / EMA 200 bearish cross (days away) and an SMA 50D / SMA 200D death cross (weeks away).
CHART PATTERNS
- Bearish Double Top / Head and Shoulders (loose): The September peak near $240 followed by a lower high near $222 in October, then a break below the ~$197-205 support band, resembles a topping structure. The measured move from the ~$240 peak to the ~$200 neckline is about $40, which projects to roughly $155-160. That objective has essentially been reached, so the pattern's downside is largely spent.
- No clean reversal pattern yet: There is no confirmed double bottom or inverted head and shoulders. The long-wick capitulation candle near $146 is the only early sign of a possible base.
- Overhead gap: The Nov 5 gap-down (~$181-200) acts as supply. Any bounce will probably stall around $180-200.
POTENTIAL SCENARIOS
- Scenario 1: Bullish Oversold Relief Bounce — RSI near 22 on capitulation volume, price at the lower Bollinger Band, and the bearish measured-move target already met favor a mean-reversion rally, though it would stay below the declining moving averages. Trigger: hold above $145.82 and a close above ~$168.89 with RSI back above 30 and MACD histogram shrinking. Target: $175-$185 (gap fill near $181.60). Invalidation: close below $145.82. (45% probability)
- Scenario 2: Bearish Trend Continuation — ADX 43.5 with −DI at 47 and an imminent death cross keep sellers in charge. Price grinds lower with only weak bounces. Trigger: break below $145.82 on rising volume. Target: $120-$130, with a tail toward $100. Invalidation: close above $181.60. (40% probability)
- Scenario 3: Neutral Base Building — Price stabilizes after the capitulation and chops between roughly $145 and $180 as volatility cools. Trigger: ADX rolls over below 30 with price inside this band. Target: $150-$170. Invalidation: close outside $145-$182. (15% probability)
PRICE TARGETS
The typical 77-day move is about $90.95 (about 58% of price). The Expected Range is about 2x that, shifted slightly toward the bullish bias, and the Target Price stays well within half a typical move of the current price.
- Target Price: $170.00 (77-day horizon, about +8.9%)
- Expected Range: $92.00 to $274.00 (width $182, about 2.0x the typical move)
- Key Levels: Support at $145.82, Resistance at $181.60
OVERALL BIAS
OVERALL BIAS: BULLISH - Price is extremely oversold (RSI 22.7) on capitulation-level volume at the lower Bollinger Band, CMF is stabilizing, and the bearish measured-move target is largely achieved, so a modest relief rally is slightly more likely than further collapse. Conviction is low, though: ADX 43.5, −DI dominance, a bearish MACD and an imminent death cross keep the downside scenario nearly as likely, and rallies should meet heavy resistance at $181-$205.
This is educational analysis and not financial advice.