NVDA 62-day bullish forecast — Nov 15, 2026
- Bias: Bullish
- Timeframe: 62 days (made Nov 15, 2026, target date Jan 15, 2027)
- Price at analysis: $162.85
- Price target: $178.00
- Expected range: $148.00 – $197.00
- Result: Pending — graded after the close on Jan 15, 2027
Get a free AI analysis of NVDA today
Analysis
TECHNICAL INDICATORS
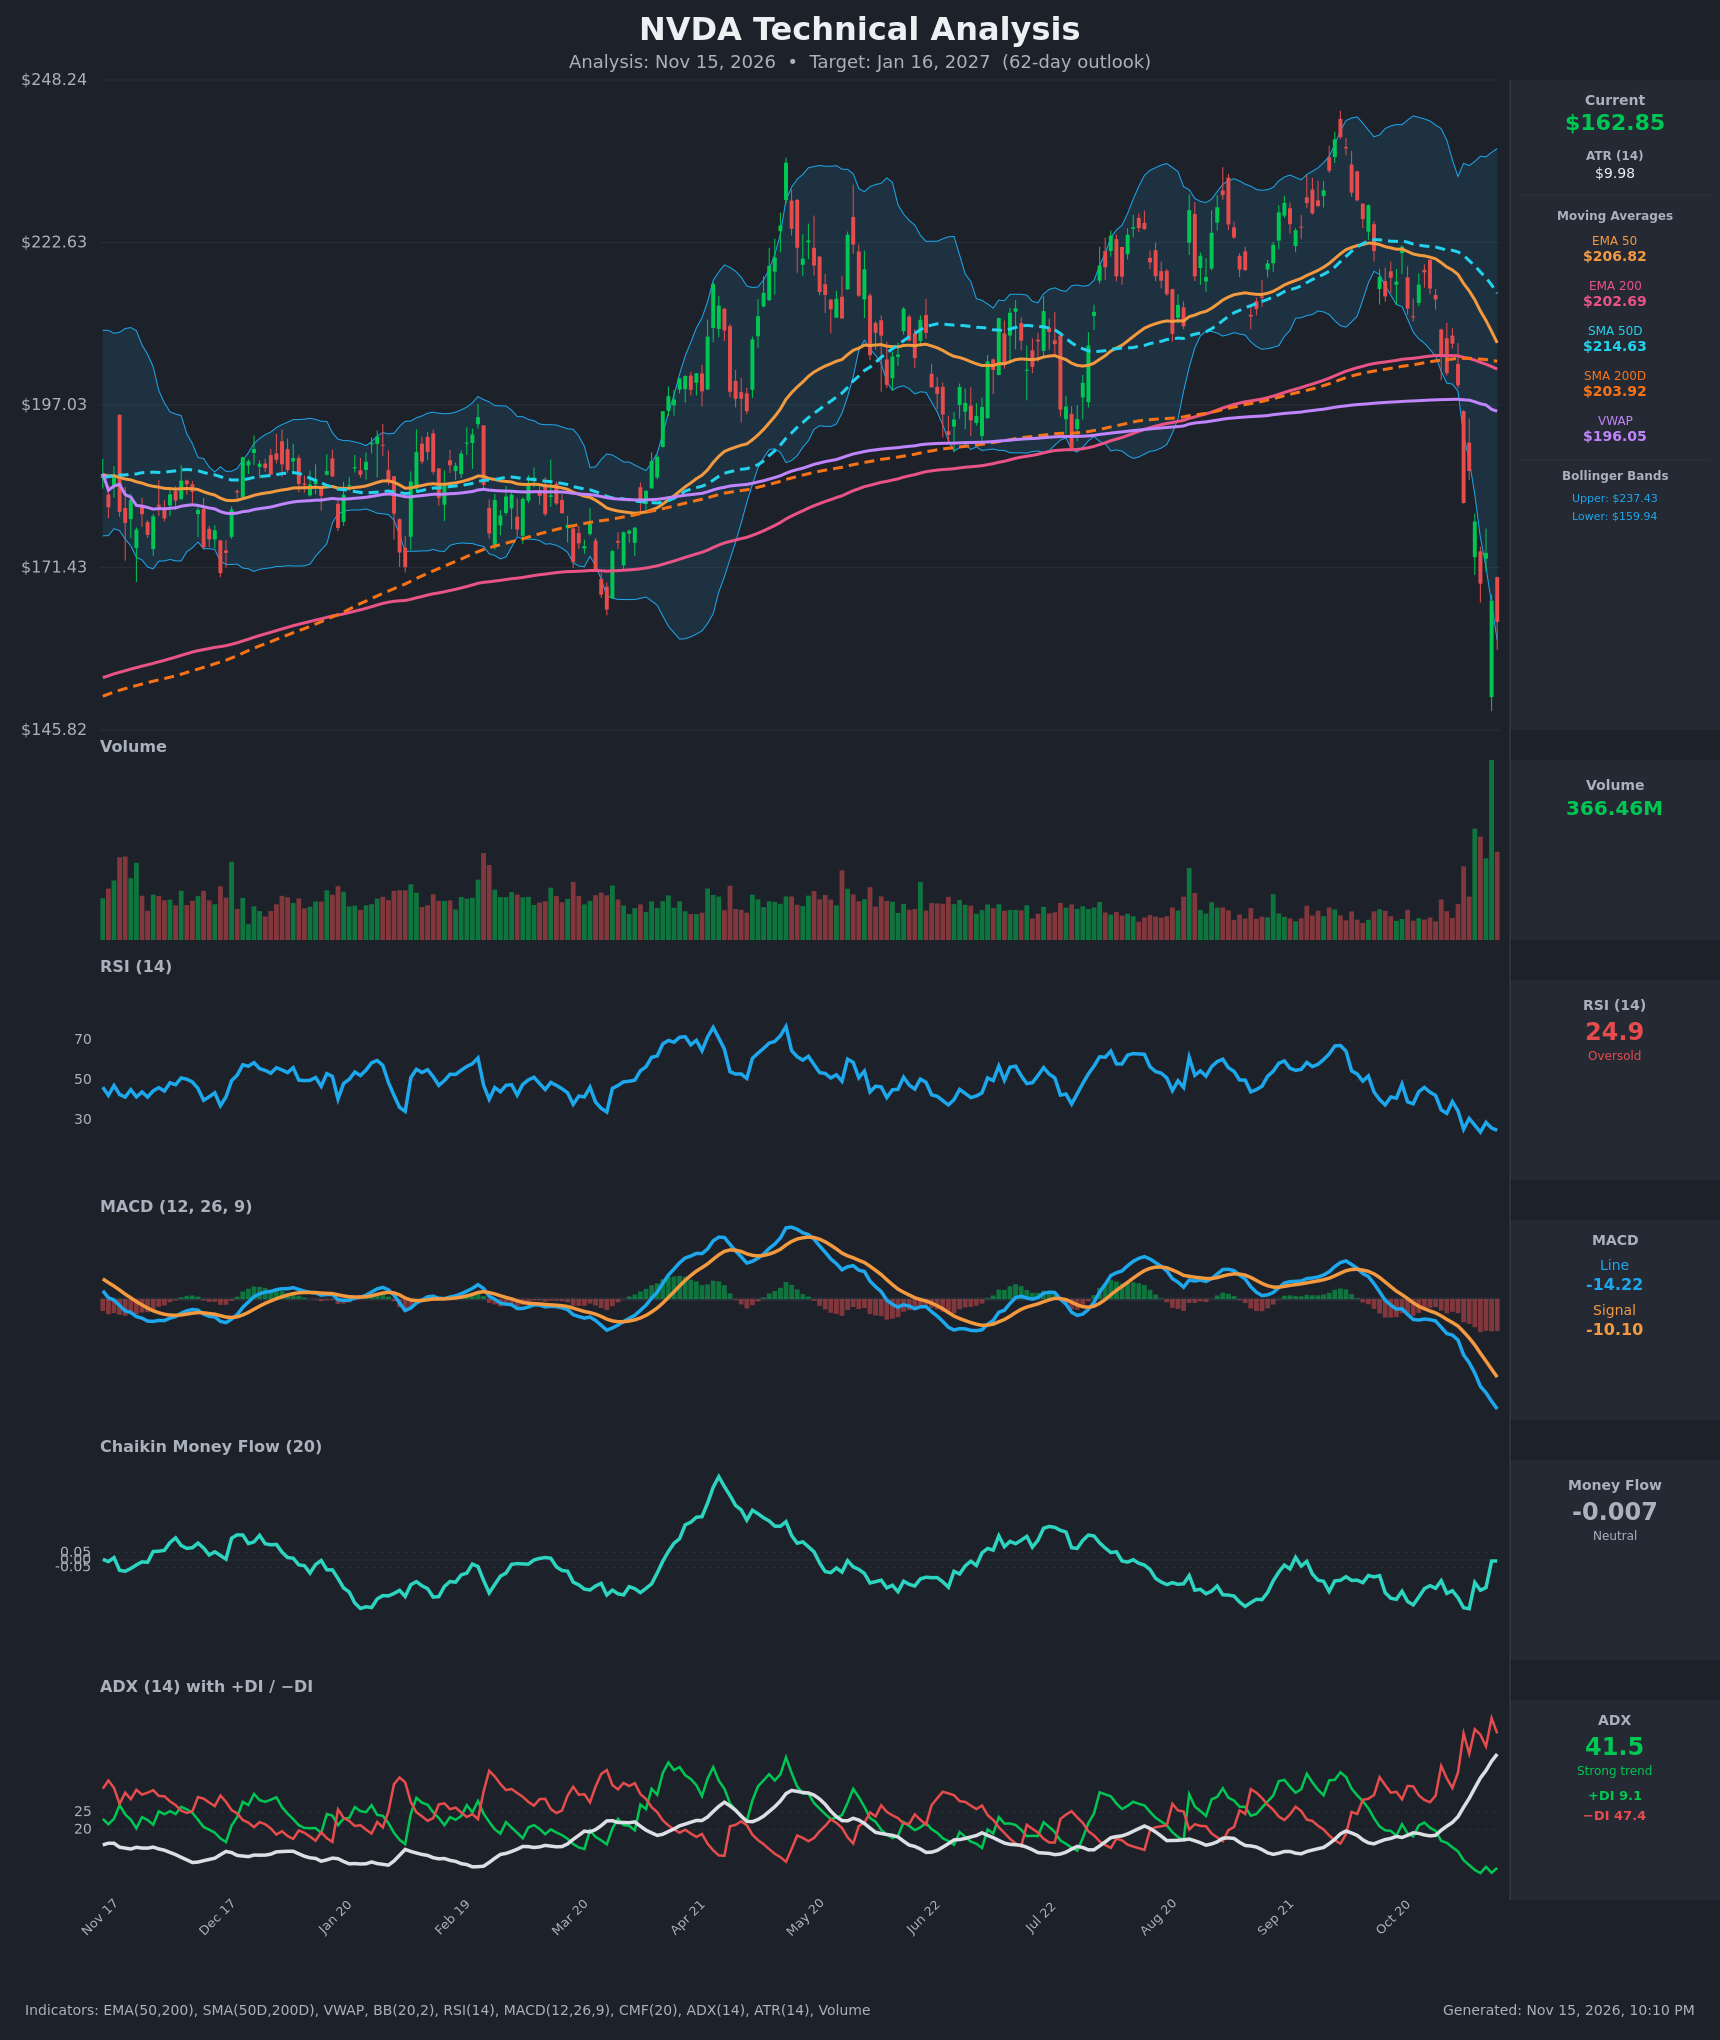
- RSI (14): 24.86, deeply oversold. It hit 23.9 on Nov 10 and 25.4 on Nov 5, so it has made repeated oversold readings in a short span. Momentum is still pointing down, but this is the lowest zone of the past year and selling is stretched. [Bullish]
- 20 EMA: The 20 EMA isn't provided, so I used the EMA 50 at $206.82 as the proxy. Price at $162.85 is about 21% below it, and the EMA 50 is rolling over (down from $220.63). It acts as heavy overhead resistance, and the gap points to a mean-reversion bounce but not a trend change. [Bearish]
- MACD: The line is -14.22 against a signal of -10.10, with the histogram at about -4.1 and widening. The bearish crossover is well established and momentum is still accelerating down. The MACD is at its most extreme reading on the chart, which fits an exhausted move but gives no reversal signal yet. [Bearish]
- Bollinger Bands (20): The bands are $159.94 to $237.43 and are very wide after the selloff. Price sits just above the lower band after riding or piercing it for several days. The long lower wick on the chart shows a failed band-walk and rejection of lower prices. A reversion toward the midline (~$198) is possible, though bands can keep walking in a strong trend. [Bullish]
- CMF (20): -0.007, neutral. It has risen sharply from -0.335 on Nov 6 to roughly flat, even as price made new lows. That suggests selling pressure is fading or buyers are absorbing the supply. [Neutral]
- ADX (14): 41.5 and rising, with −DI at 47.4 and +DI at 9.1. This is a strong downtrend with the bears fully in control. An ADX this high with +DI so compressed often marks the late stage of a move, so it argues for a bounce more than for further acceleration. [Strong Trend – Bearish]
- Volume: 366.46M, the largest bar on the chart by a wide margin and several times the average. Heavy volume at a multi-month low with a long lower wick looks like capitulation or climactic selling. Volume has also been elevated for the last 5-6 sessions, showing a forced liquidation. [Capitulation / Potentially Bullish]
DIVERGENCES & TRENDS
- CMF vs. price: CMF has recovered from -0.33 to neutral while price made new lows. This is an early bullish divergence in money flow.
- RSI vs. price: There is no clean RSI divergence yet, because price and RSI are both at lows. The RSI low on Nov 10 (23.9) came at $168.89, and RSI is now 24.9 at a lower price of $162.85. That is a marginal, not-yet-confirmed bullish divergence.
- Moving averages: Price is below the EMA 50, EMA 200, SMA 50D, SMA 200D and VWAP. The EMA 50 ($206.82) crossed below the EMA 200 ($202.69) is not complete, since it is still above, but it is converging fast and a bearish cross is likely within days. The SMA 50D ($214.63) is falling toward the SMA 200D ($203.92) and a death cross looks likely in the coming weeks.
- MACD: The bearish crossover is deep and the histogram is still expanding. There is no sign of momentum turning.
- ADX/DI: −DI has dominated since Oct 26, and ADX has climbed from 18.9 to 41.5. The trend is mature.
- Price structure: The September high near $240 was followed by a lower high near $222 in October. The break below the ~$200 base (SMA 200D, VWAP) triggered a roughly 25% decline in 15 sessions.
CHART PATTERNS
- Distribution top (Bearish Head and Shoulders / Double Top analog): The September peak, the lower October high, and the break of the ~$200 support zone resemble a topping structure. The measured move from the ~$240 top to the ~$200 neckline is about $40, which projects to ~$160. Price has essentially reached that target.
- Capitulation low: The long lower wick near $146-150 on record volume is a classic exhaustion bar. No reference pattern is formed, but the rebound zone would be the prior breakdown area ($181-$200).
- Risk pattern (Bearish Flag / Pennant): If the bounce is weak and drifts sideways under $180-$186, the structure becomes a bearish flag and a continuation toward $140 becomes likely.
- Targets: The upside retracement zone is the $178-$186 area (about 38-50% of the Nov 5-13 leg), with the next barrier at $197-$204 (VWAP and the 200-day averages).
POTENTIAL SCENARIOS
- Scenario 1: Bullish Capitulation Rebound — Climactic volume, RSI below 25 and a rising CMF suggest the selling is exhausted, and a relief rally toward the lower end of the broken range follows. Price is 21% below the EMA 50, so a mean-reversion bounce is likely even within a larger downtrend. Trigger: a daily close above $172-$175 with RSI back above 35 and MACD histogram shrinking. Target: $178-$186, with an extension to $197. Invalidation: a daily close below $146-$150 (the capitulation low). (50% probability)
- Scenario 2: Bearish Trend Continuation — The ADX of 41.5 and −DI of 47.4 show powerful bearish control. The EMA/SMA crosses and the 200-day breakdown keep sellers active, and any bounce stalls under $181-$186 as a bearish flag. Trigger: a break below $159.94 (lower band) and $150 on a close. Target: $140-$145, with an extreme of $130. Invalidation: a close above $186.64. (35% probability)
- Scenario 3: Neutral Base-Building Range — Price stabilizes after the shock and chops between $150 and $180 as volatility contracts. Trigger: several sessions of low-volume, narrow-range candles holding above $155. Target: ~$160-$170. Invalidation: a break outside $146-$186. (15% probability)
PRICE TARGETS
- Target Price: $178.00 (62-day horizon, about +9.3% from $162.85)
- Expected Range: $148.00 to $197.00 (width $49.00 ≈ 30% of current price, consistent with the 61-180 day guidance)
- Key Levels: Support at $150.00, Resistance at $181.60
OVERALL BIAS
OVERALL BIAS: BULLISH - A climactic-volume capitulation with a long lower wick, RSI near 25, price hugging the lower Bollinger Band, and CMF recovering from -0.33 to neutral all point to a relief rally over 62 days. The conviction is modest, because the ADX of 41.5, −DI dominance, a deep bearish MACD and the pending moving-average crosses mean the larger trend is still down, so any bounce will likely stall below the $197-$204 resistance cluster.
This is educational analysis and not financial advice.