NVDA 43-day bearish forecast — Nov 19, 2026
- Bias: Bearish
- Timeframe: 43 days (made Nov 19, 2026, target date Dec 31, 2026)
- Price at analysis: $150.96
- Price target: $141.50
- Expected range: $90.00 – $220.00
- Result: Pending — graded after the close on Dec 31, 2026
Get a free AI analysis of NVDA today
Analysis
TECHNICAL INDICATORS
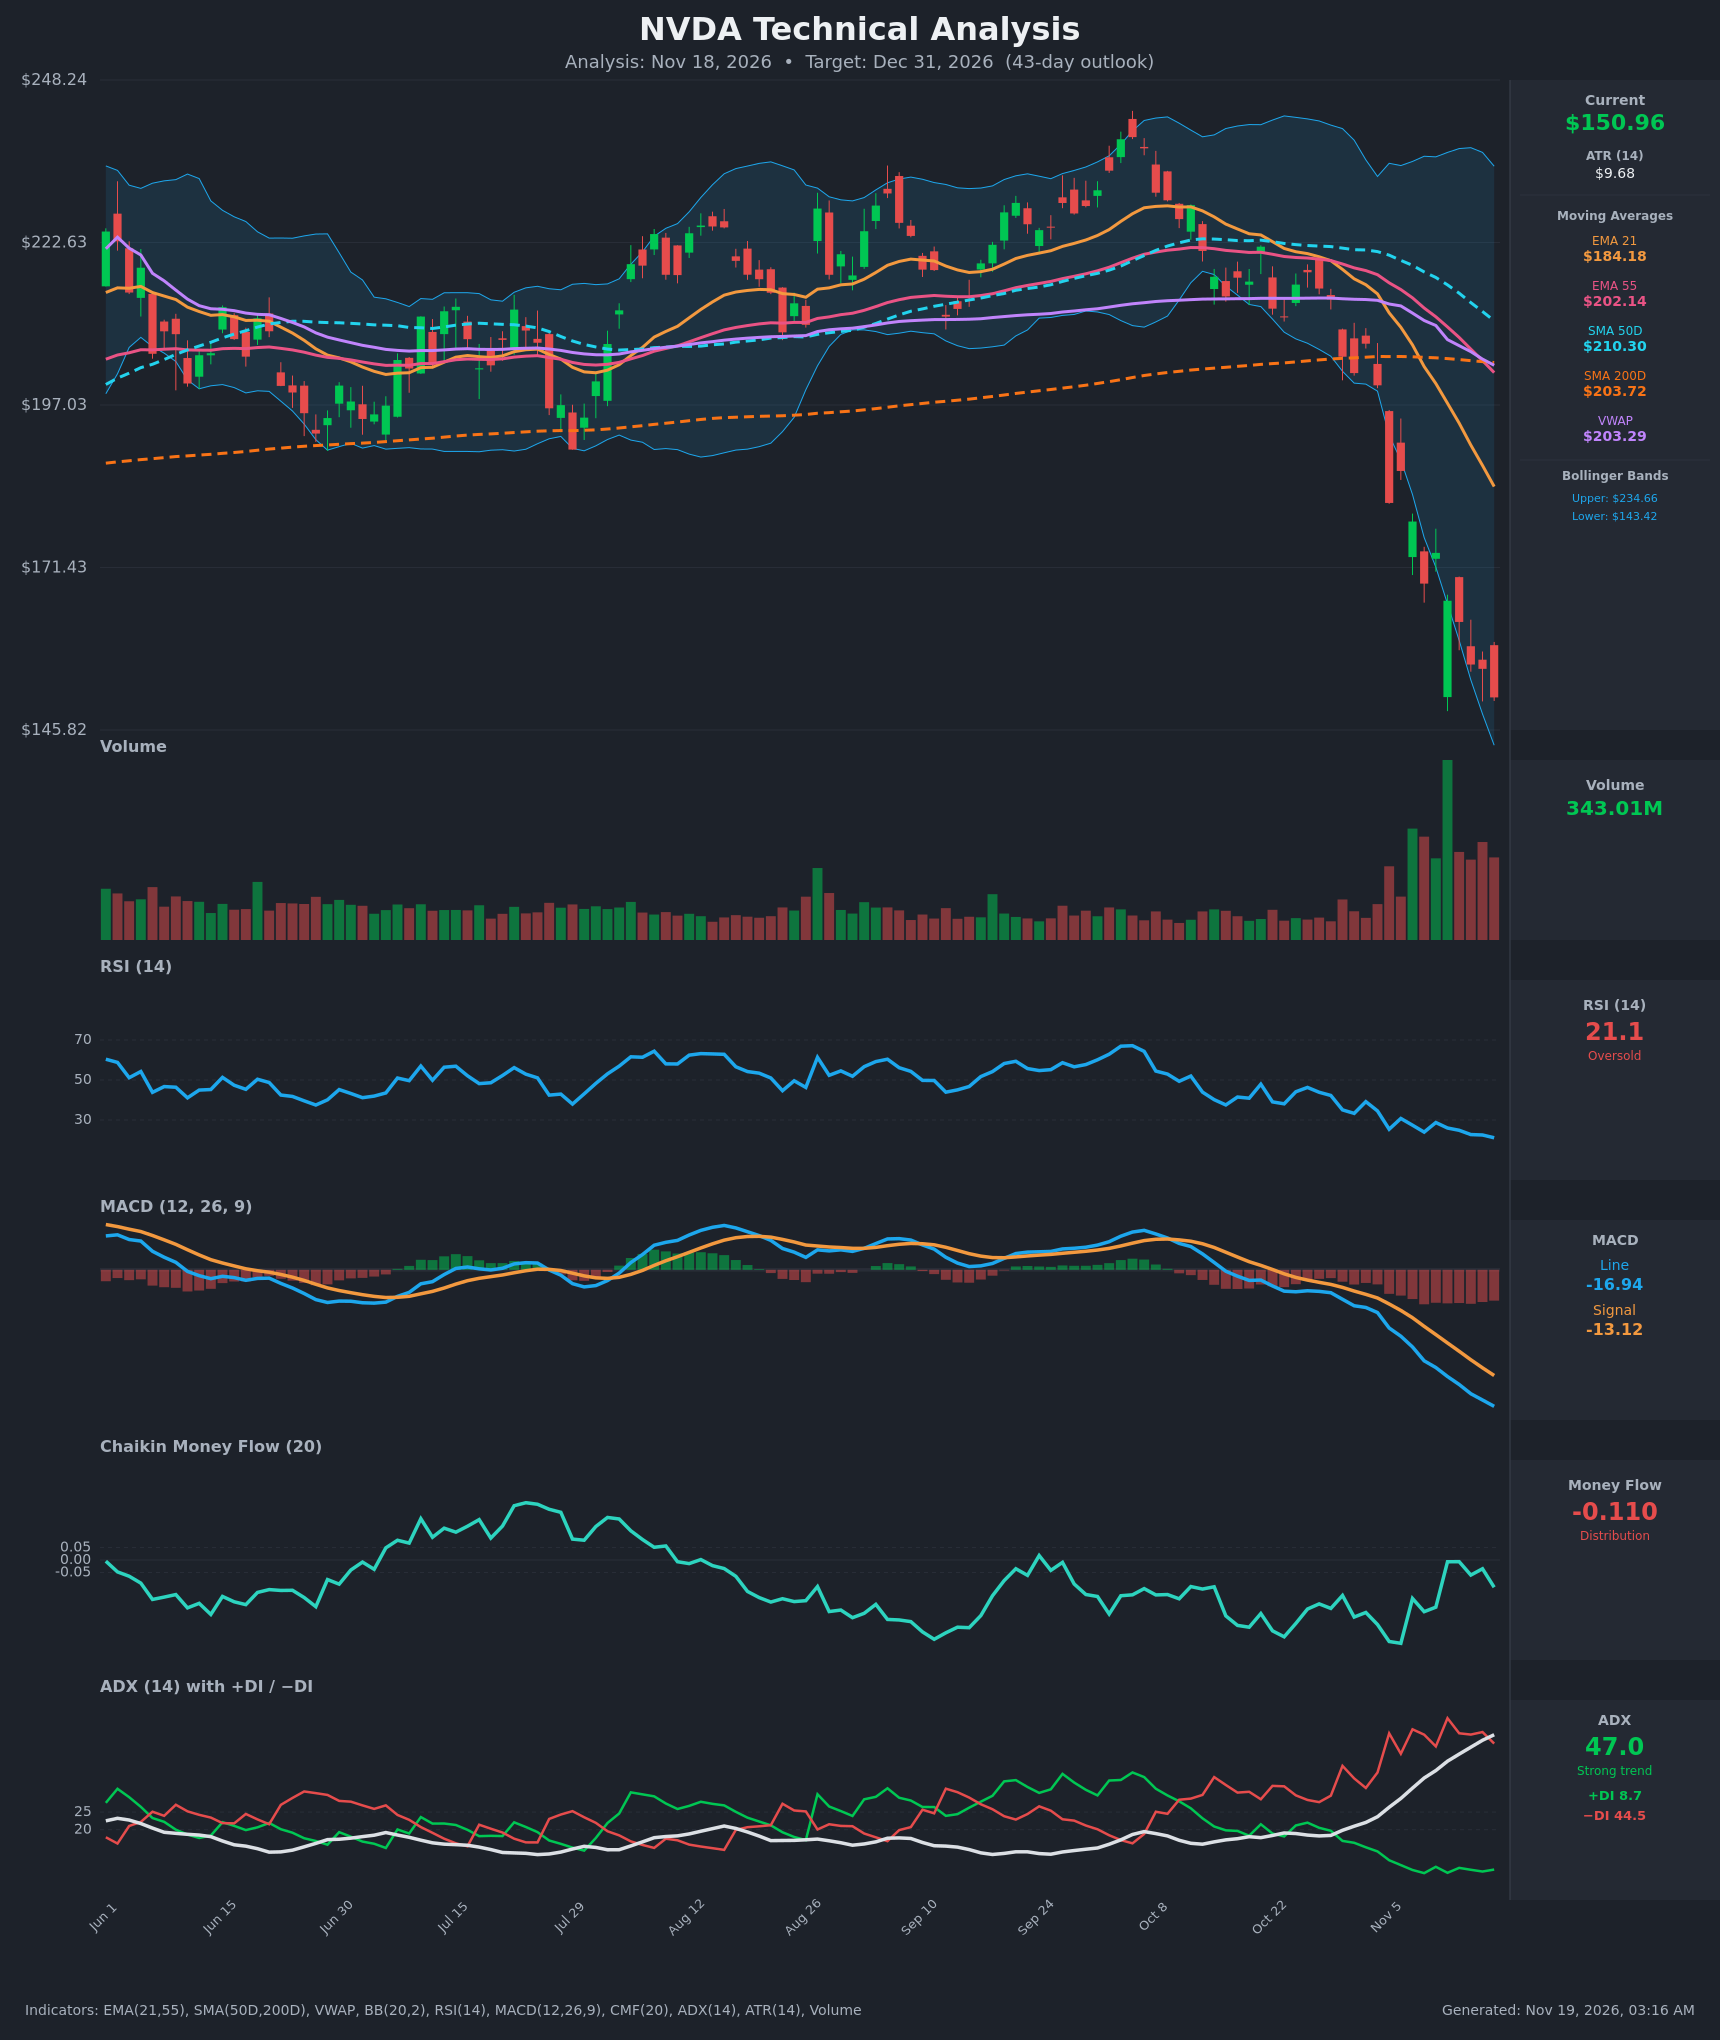
- RSI (14): 21.10, deep in oversold territory (<30) and falling steadily from 42 on Oct 29. It has made lower lows without any bullish divergence. Oversold readings in a strong trend can stay pinned for weeks. [Bearish]
- Moving Averages: Price ($150.96) is below every average, so all of them act as overhead resistance. EMA 21 is $184.18, EMA 55 is $202.14, SMA 50D is $210.30, SMA 200D is $203.72 and VWAP is $203.29. EMA 21 is already below EMA 55 (a bearish crossover). SMA 50D is still above SMA 200D, but the gap has narrowed to about $6.6 and is closing quickly, so a death cross is likely within days. Price is about 26% below the 200D, which is a stretched, extended condition. [Bearish]
- MACD: The line (-16.94) is below the signal (-13.12), so the histogram is about -3.8 and still widening. Both lines are accelerating lower, with no sign of a turn yet. [Bearish]
- Bollinger Bands (20): Price is $150.96 against a lower band of $143.42, a middle band of about $189.04 and an upper band of $234.66. It is hugging the lower band (%B about 0.08) after a "walk down the band." The bands are very wide, so volatility has expanded sharply. This is stretched but not a reversal signal on its own. [Bearish]
- CMF (20): -0.110, below the -0.05 threshold. It has been negative for most of the past 20 bars, which shows persistent distribution. It improved briefly to about -0.007 on Nov 12-13 but has rolled back over. [Distribution]
- ADX (14): 47.0 and rising, which is a very strong trend. −DI (44.5) is far above +DI (8.7), and the bears have been in control since Oct 29. [Strong Trend – Bearish]
- Volume: 343.01M is well above the earlier base. There was a huge-volume green candle during the decline (a failed capitulation or bounce attempt) and heavy red volume on the later breakdown bars. Heavy volume on down moves confirms the selling. It also hints at a possible exhaustion phase, but price has not yet confirmed one. [Bearish with possible exhaustion]
DIVERGENCES & TRENDS
- There is no bullish divergence. RSI (21.1), MACD (-16.94) and price all made fresh lows together on Nov 18, so momentum confirms price.
- The one constructive sign is the sharp one-day reversal candle on very high volume (a climactic bar). It failed to hold, because price made lower lows afterward.
- ADX has climbed from 18 to 47 in about 3 weeks, and −DI dominates. This is a mature, high-momentum downtrend. ADX above 45 sometimes signals trend exhaustion, but it has not peaked yet.
- EMA 21 crossed below EMA 55 around Oct 29-30. The SMA 50D / SMA 200D death cross is imminent. MACD crossed bearish earlier and the gap is widening.
- Price is about 18% below EMA 21 and at a Bollinger lower band. A relief bounce is possible, but the trend has not shown it is ending.
CHART PATTERNS
- The prior range (June to late October, roughly $200-$235 with higher lows around $197-$200) looks like a large consolidation or distribution base. The late-October breakdown through its lower boundary resembles a Bearish Head and Shoulders / Triple Top style reversal. The failed rally near $240 was the head, and the neckline break near $200 triggered the decline.
- The measured move from the range (about $240 down to about $200, roughly $40) projects to about $160. That target has been exceeded, which shows the downside momentum is stronger than a standard measured move.
- The sharp drop is a near-vertical, unsupported leg with no flag or pennant consolidation yet. A bounce would likely form a Bearish Flag/Pennant below $175-$185 before continuation.
- The recent candles ($155 to $150) show a tight, small-bodied, descending stall near the lower band. This is a possible base but is unconfirmed.
POTENTIAL SCENARIOS
- Scenario 1: Bearish Trend Continuation — The downtrend keeps grinding lower, with the death cross, falling EMAs and heavy distribution keeping rallies shallow. Trigger: a daily close below $145-$143 (the recent low and lower Bollinger band). Target: $125-$135, with an extension toward $110 if selling accelerates. Invalidation: a daily close above $175 on rising volume. (50% probability)
- Scenario 2: Bullish Oversold Relief Bounce — RSI near 21 and a climactic volume spike set up a mean-reversion rally toward the falling EMA 21. Trigger: a reclaim of $160-$165 with a bullish MACD histogram turn and CMF back above 0. Target: $175-$185 (EMA 21 at $184). The bounce would likely stall under the declining averages. Invalidation: a close back below $143. (38% probability)
- Scenario 3: Neutral Base-Building — Price stabilizes between about $140 and $165 as selling exhausts and ADX rolls over. Trigger: lower volume and ADX peaking with flat RSI near 25-35. Target: the $140-$165 box. Invalidation: a close outside either edge. (12% probability)
PRICE TARGETS
Typical move over 43 days is about $65.37. The chart shows a strongly confirmed downtrend with all trend indicators aligned bearish, but oversold conditions limit how far the center estimate sits from the current price. The range band is shifted slightly lower toward the target.
- Target Price: $141.50 (43-day outlook)
- Expected Range: $90.00 to $220.00 (about 2x the typical move wide)
- Key Levels: Support at $145.00, Resistance at $173.73
OVERALL BIAS
OVERALL BIAS: BEARISH - Price is below all key moving averages, the EMA 21/55 bearish crossover is in place and a death cross is imminent. MACD is falling with a widening histogram, ADX is 47 with −DI dominant, and CMF shows distribution. The extreme oversold RSI (21) raises the odds of a bounce, but there is no bullish divergence yet, so the path of least resistance remains lower.
This is educational analysis and not financial advice.