NVDA 34-day bullish forecast — Nov 15, 2026
- Bias: Bullish
- Timeframe: 34 days (made Nov 15, 2026, target date Dec 18, 2026)
- Price at analysis: $162.85
- Price target: $169.00
- Expected range: $150.00 – $178.00
- Result: Pending — graded after the close on Dec 18, 2026
Get a free AI analysis of NVDA today
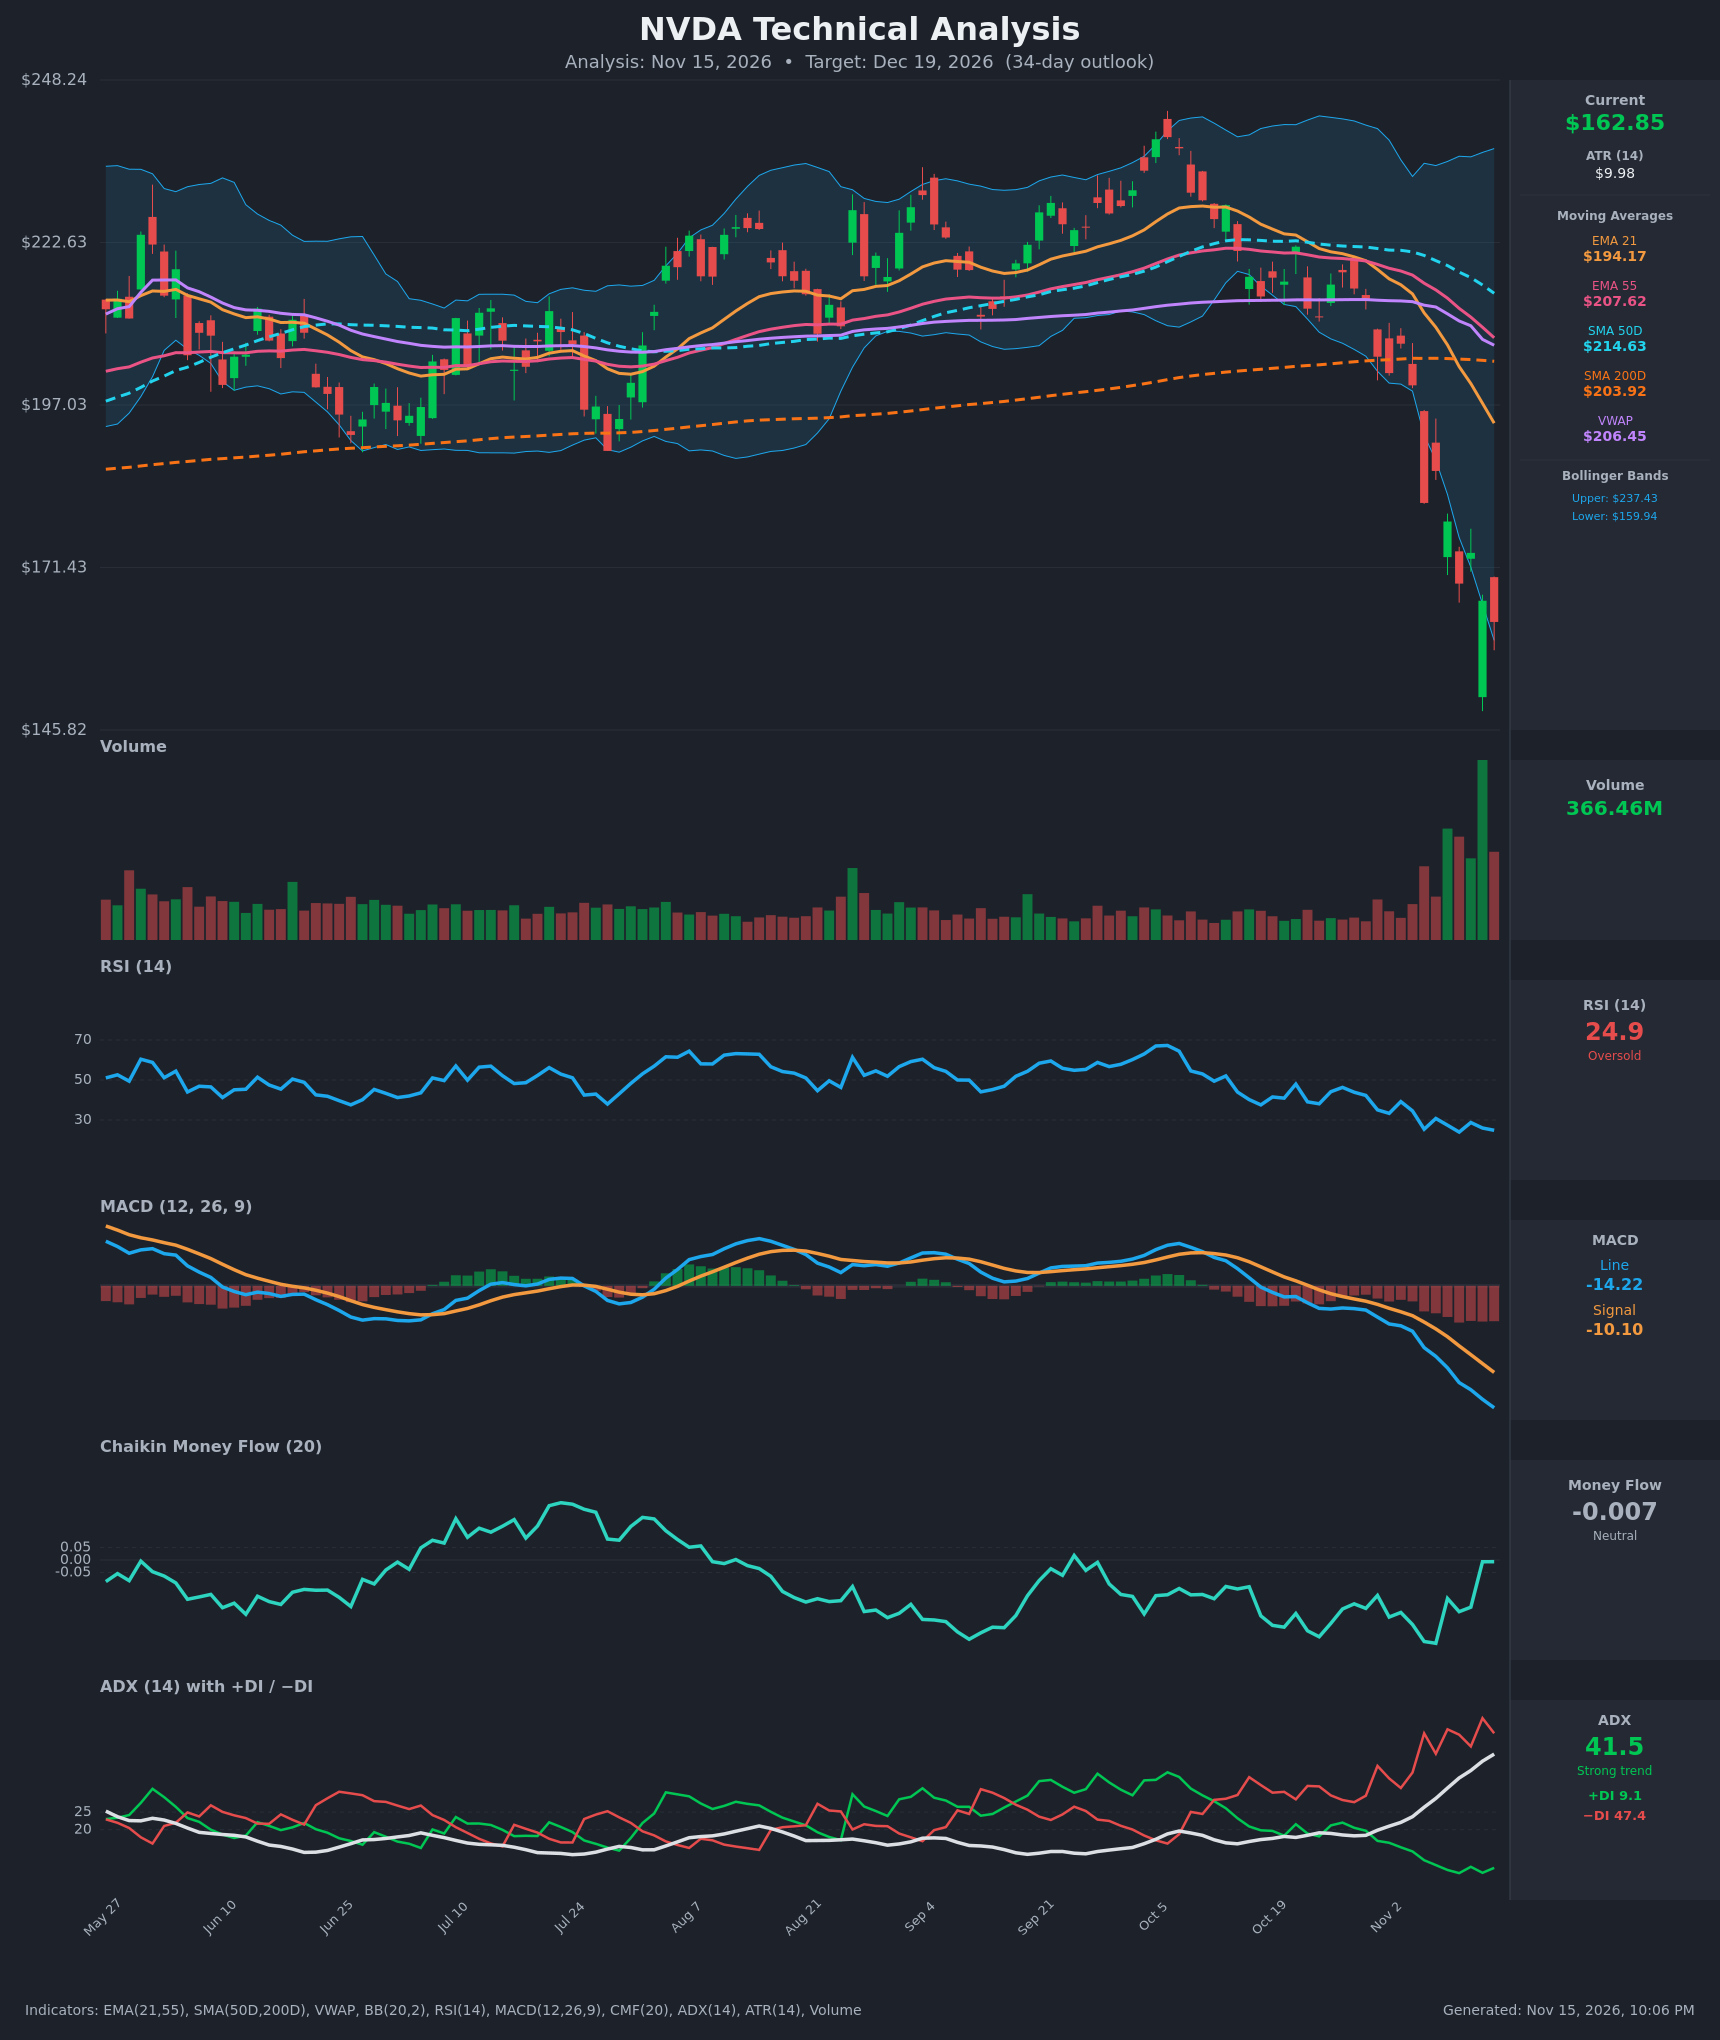
Analysis
TECHNICAL INDICATORS
- RSI (14): 24.86, deeply oversold. It has made lower lows from 44 (Oct 26) to 23.9 (Nov 10) and 24.9 now, so momentum is still weak, but the reading is near its most extreme. Readings this low usually come with exhaustion and mean-reversion bounces. [Neutral, leaning Bullish on the oversold reading]
- 20 EMA (EMA 21): $194.17, about 16% above price and falling steeply. EMA21 crossed below EMA55 ($207.62) in early November, so the short-term trend is down. The EMA21 is overhead resistance, and price is far stretched from it. [Bearish]
- MACD: Line -14.22 is below signal -10.10 and the gap is widening. The histogram is increasingly negative, the bearish crossover is well established, and there is no sign of a turn yet. [Bearish]
- Bollinger Bands (20): Upper $237.43 and lower $159.94, so price at $162.85 is hugging the lower band after walking below it. The bands have expanded sharply, which confirms a volatility spike. A close this extended below the band often reverts toward the mean, but "walking the band" can persist in strong trends. [Neutral / oversold-bullish tilt]
- CMF (20): -0.007, neutral. It has recovered from -0.33 (Nov 6) to about 0, a notable improvement while price made new lows. That suggests selling pressure is fading, which is a bullish divergence. [Neutral]
- ADX (14): 41.5 and rising, with -DI at 47.4 well above +DI at 9.1. This is a strong, established downtrend with bears firmly in control. +DI at 9.1 is extremely low, which often marks an exhausted trend. [Strong Trend – Bearish]
- Volume: 366.46M, the highest in the visible window and several times the average. Heavy volume after a roughly 25% drop from $216 looks like capitulation or climactic selling, with a long lower wick visible on the high-volume candle. [Capitulation / possible exhaustion]
DIVERGENCES & TRENDS
- CMF vs. price: CMF rose from -0.33 to about 0 while price made new lows ($168.89 to $162.85). This is a bullish divergence and suggests selling is losing force.
- RSI vs. price: RSI is making similar lows (23.9 vs. 24.9) at lower prices. It is a mild, early sign of slowing downside momentum but not a confirmed divergence.
- MACD: It is still diverging bearishly, with no turn in the line or histogram.
- Moving averages:
- Price is below every MA, including the SMA200D ($203.92), which it broke on Oct 30–Nov 4.
- EMA21 is below EMA55.
- SMA50D ($214.63) is falling toward SMA200D ($203.92), so a death cross is approaching.
- Price is below VWAP ($206.45).
- DI/ADX: -DI has been above +DI since Oct 26 and ADX rose from 18 to 41.5. This trend is mature and stretched, so the risk of a relief bounce is high even if the larger trend stays down.
CHART PATTERNS
- No reference pattern is cleanly completed. The move is a near-vertical breakdown from a roughly $216–$238 range, so a clean target measurement is not possible.
- Bullish Double Bottom: If price retests the climactic low near $147–$150 and holds on lower volume, a double bottom could form, with an upside neckline near $173–$182.
- Bearish Flag/Pennant (continuation): If the bounce is weak and capped at $175–$182, it would resemble a bearish flag. Continuation would then target roughly $145 or lower, using the measured move of the prior drop.
- Upside target: A relief bounce could retrace 38–50% of the $216 to $147 drop, which gives about $173–$181. The 21 EMA near $194 is the outer limit.
POTENTIAL SCENARIOS
- Scenario 1: Bullish Capitulation Relief Bounce — Climactic volume, RSI below 25, and a CMF recovery point to selling exhaustion. Price mean-reverts toward the lower-to-mid zone of the prior gap. Trigger: a daily close above $173.73, then above $181.60. Target: $172–$181, with an extension to the $194 EMA21 being unlikely. Invalidation: a daily close below $147. (50% probability)
- Scenario 2: Bearish Trend Continuation — The strong trend (ADX 41.5, -DI 47) persists, a death cross forms, and rallies are sold at the falling EMA21. Trigger: a break below $159.94 and then $147 on rising volume. Target: $140–$147. Invalidation: a close above $181.60. (35% probability)
- Scenario 3: Neutral Basing Range — After the capitulation, price chops between about $148 and $175 as the indicators reset. Trigger: failure to break either $147 or $175. Target: $155–$170. Invalidation: a close outside the range on strong volume. (15% probability)
PRICE TARGETS
- Target Price: $169.00 (34-day, about +3.8% from $162.85)
- Expected Range: $150.00 to $178.00 (width $28, about 17.2% of price, consistent with the 30–60 day guidance of 12–18%)
- Key Levels: Support at $148.00 (climactic low zone), Resistance at $181.60 (Nov 5 breakdown close and gap zone)
Self-check: $28 / $162.85 = 17.2%, which fits the 34-day timeframe.
OVERALL BIAS
OVERALL BIAS: BULLISH - The trend is strongly bearish, but the combination of extreme oversold RSI (24.9), price below the lower Bollinger Band, record capitulation volume, and a CMF recovery from -0.33 to about 0 favors a partial mean-reversion bounce within 34 days. Conviction is modest. A break below $147 would flip the bias bearish, and rallies into $175–$182 will face heavy overhead supply.
This is educational analysis and not financial advice.