NVDA 83-day bullish forecast — Nov 15, 2026
- Bias: Bullish
- Timeframe: 83 days (made Nov 15, 2026, target date Feb 5, 2027)
- Price at analysis: $162.85
- Price target: $177.00
- Expected range: $146.00 – $192.00
- Result: Pending — graded after the close on Feb 5, 2027
Get a free AI analysis of NVDA today
Analysis
TECHNICAL INDICATORS
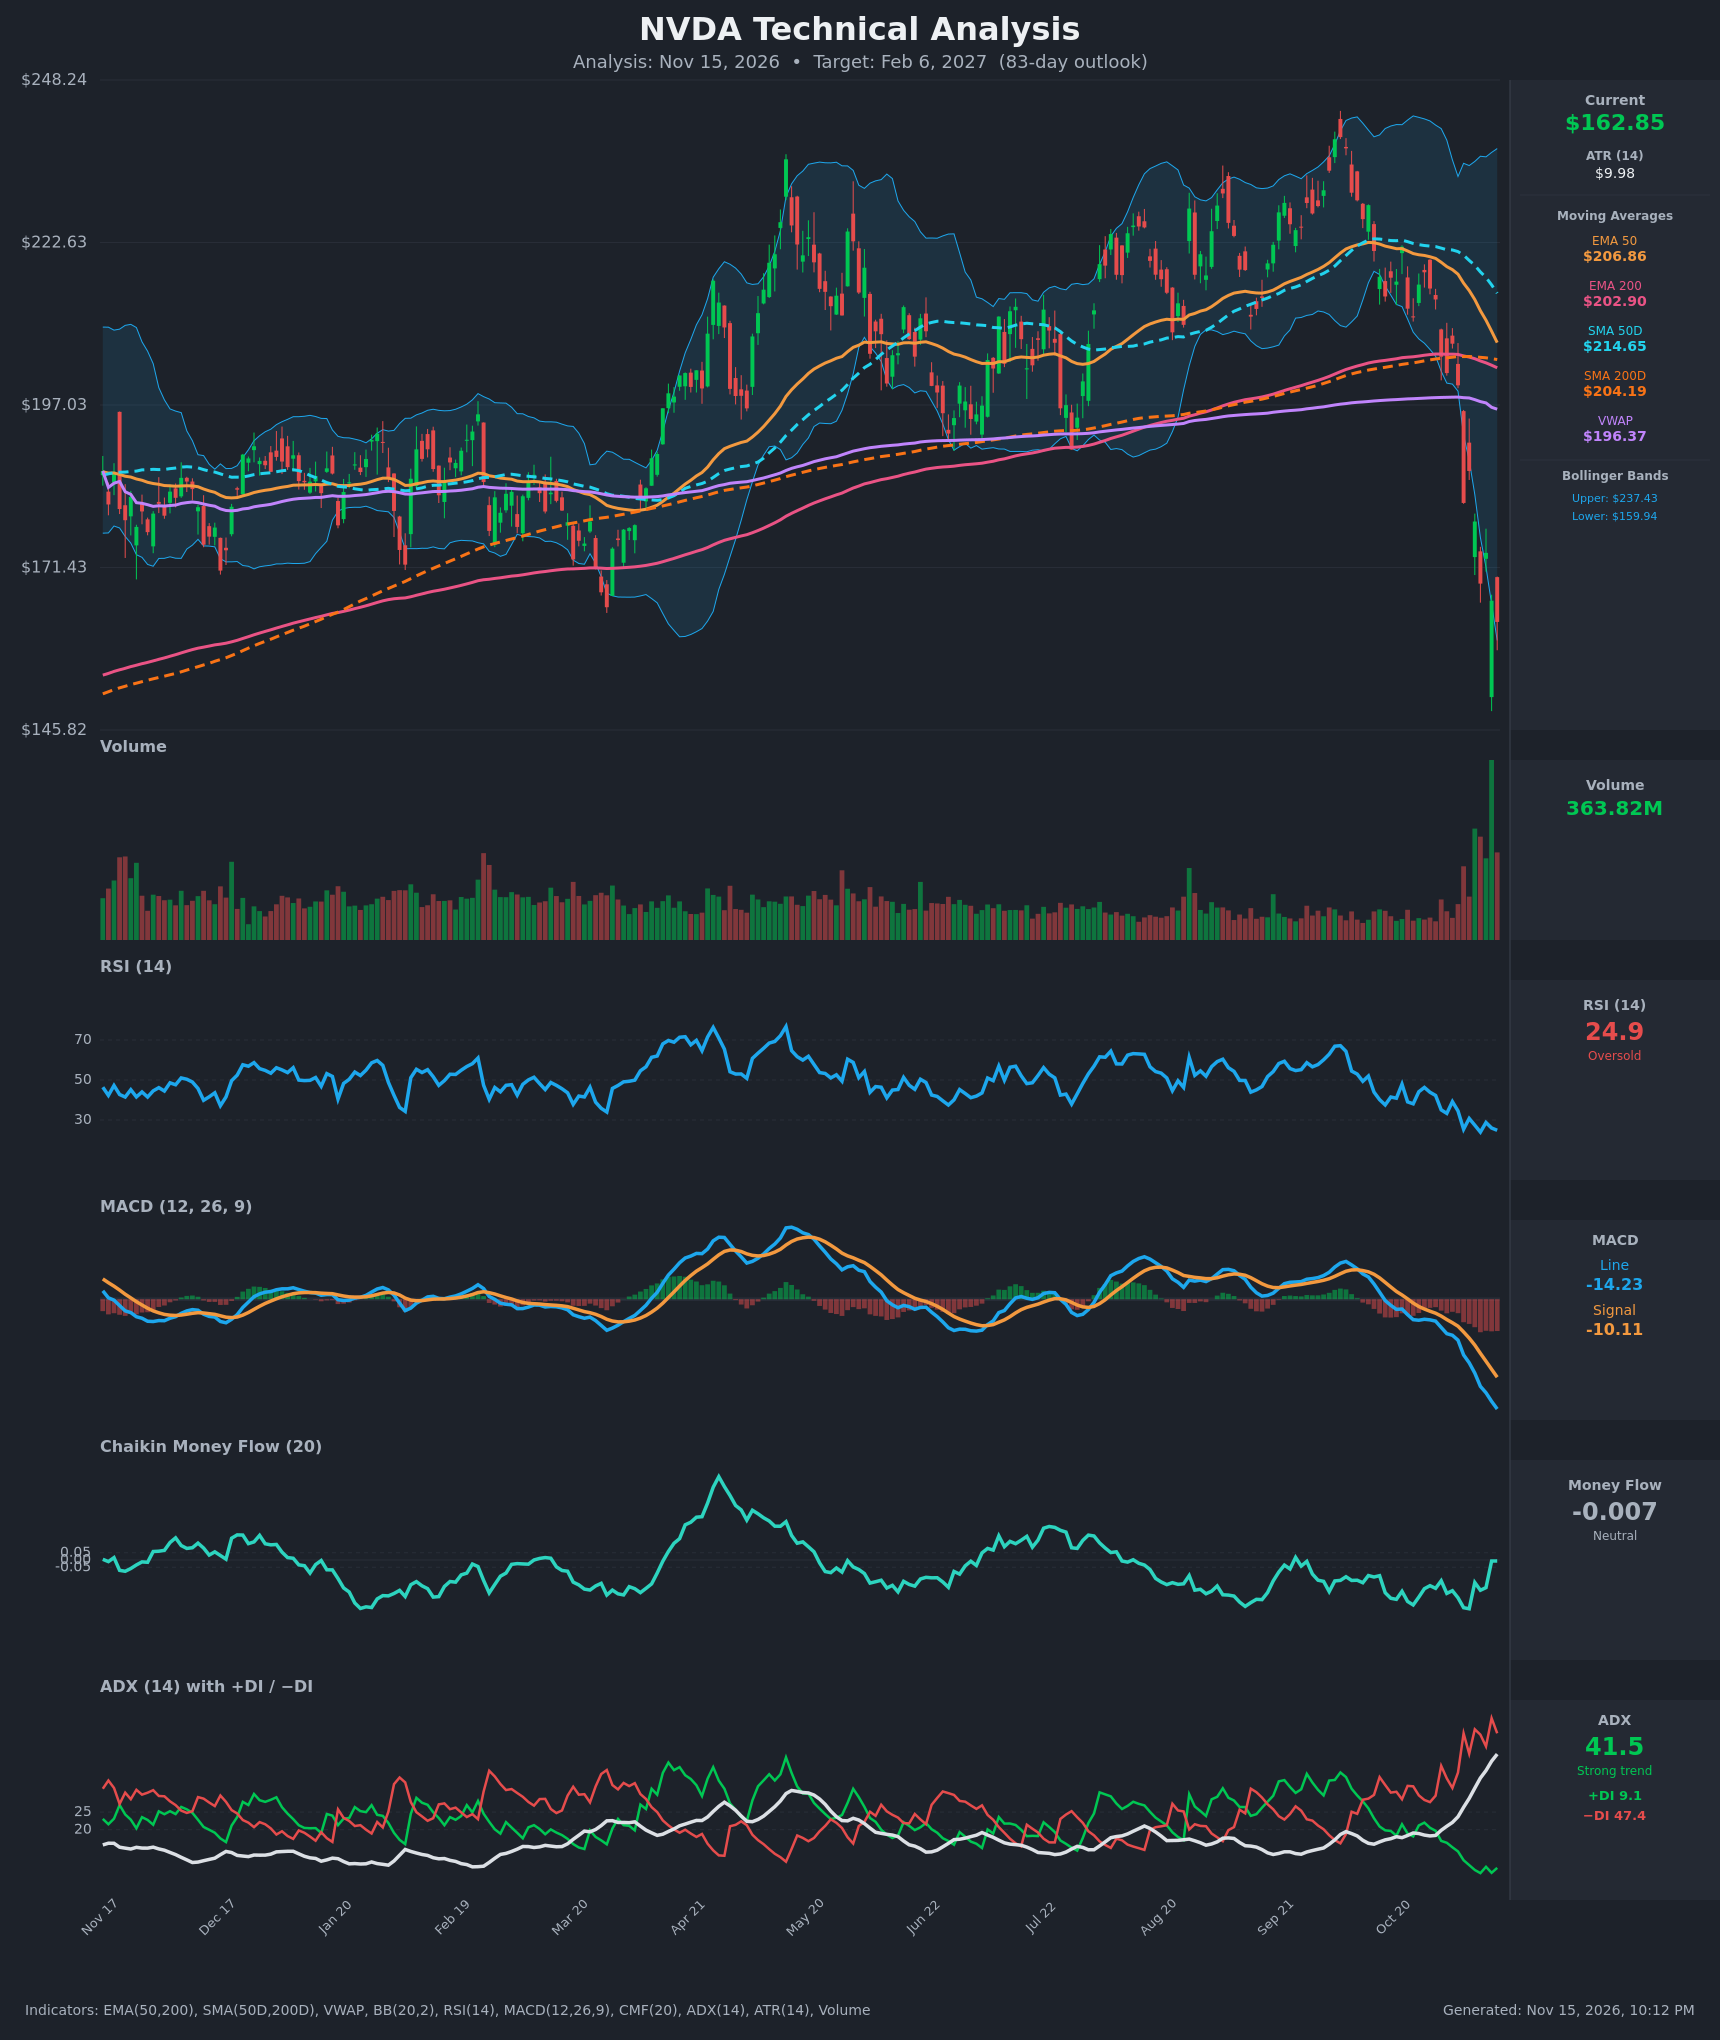
- RSI (14): 24.86, in oversold territory. It has been below 30 on most of the last 5 sessions (low of 23.9 on Nov 10). The Nov 13 reading is slightly higher than Nov 10 even though price is lower, a mild bullish divergence, but momentum is still pointing down. [Bullish] (oversold, mean-reversion setup)
- 20 EMA: Not supplied. The EMA 50 at $206.86 is a proxy: price is about 21% below it, and the EMA 50 is sloping down steeply. Overhead averages are resistance, not support. [Bearish]
- MACD: Line -14.23 is below Signal -10.11, a histogram of about -4.1 that has widened every session. The bearish crossover is well established and there is no sign of a turn yet. [Bearish]
- Bollinger Bands (20): Price at $162.85 is hugging the lower band ($159.94), with the last candles piercing it. The bands have expanded sharply (upper $237.43), so this is a volatility expansion. Walking the band is bearish, but a close this stretched usually leads to a relief bounce. [Neutral] (stretched, bounce-prone but still trending)
- CMF (20): -0.007, neutral. It improved from about -0.33 on Nov 5 to roughly zero while price made new lows, so selling pressure is being absorbed. This is a bullish divergence. [Neutral] (improving, no longer distribution)
- ADX (14): 41.5 and rising, with +DI 9.1 and −DI 47.4. The bears are in firm control of a very strong trend. ADX above 40 with a +DI this low often marks a mature, late-stage move. [Strong Trend – Bearish]
- Volume: 363.82M, the highest bar on the chart by a wide margin, and it came on a roughly 25% drop in two weeks. The candles show a long lower wick near $148 and a partial recovery. This looks like climactic or capitulation volume, which often marks a short-term low but needs confirmation. [Capitulation / Potential Exhaustion]
DIVERGENCES & TRENDS
- Bullish divergences: RSI (23.9 → 24.9) and CMF (-0.33 → -0.007) are both firming while price makes lower lows. Combined with record volume and a long lower wick, this suggests selling exhaustion.
- Trend: Price is below EMA 50, EMA 200, SMA 50D, SMA 200D and VWAP ($196.37). It has fallen from about $245 to $162.85, with −DI dominant and ADX accelerating.
- Moving-average crossovers: EMA 50 ($206.86) is falling toward EMA 200 ($202.90), and SMA 50D ($214.65) is falling toward SMA 200D ($204.19). Both gaps are closing by roughly $1 or more per day, so a death cross is likely within 1–3 weeks. That is a lagging bearish headline that will cap rallies.
- MACD: The bearish crossover is long past, and the line is at its lowest level on the chart. Momentum is extended, which usually favors a bounce, not a straight-line decline.
- Price gaps: Heavy gap-down moves at $181.60 (Nov 5) and $168.89 (Nov 10) leave overhead supply to fill.
CHART PATTERNS
- Bearish Double Top: The April high (about $232) and the autumn high (about $245) form a double-top structure. The neckline near $197 broke on heavy volume. The measured move is about $48 ($245 − $197), giving a target near $149. That level was essentially hit at the $148 capitulation low, so the pattern's downside objective is largely fulfilled.
- Bearish continuation gap structure: The sequence of gap-downs shows a vertical, impulsive decline, not a base. It has no bullish reversal pattern yet (no double bottom or inverted H&S).
- Possible Bullish Double Bottom / base: Only if price retests $148–$155 and holds on lower volume, with a neckline near $181.60. This is a developing possibility, not a confirmed pattern.
POTENTIAL SCENARIOS
- Scenario 1: Bullish Capitulation Low and Relief Rally — The record-volume flush near $148 marks the low, and RSI/CMF divergences resolve upward. Price retraces part of the drop, filling the gaps toward the $181–$190 area, but stalls below the falling EMAs. Trigger: daily close above $168.89 followed by $181.60. Target: $177–$190. Invalidation: daily close below $148. (48% probability)
- Scenario 2: Bearish Trend Continuation — The death cross confirms, rallies fail at $168–$175, and the trend extends with ADX above 40 and −DI dominant. Trigger: close below $155, then a break of $148. Target: $135–$145. Invalidation: daily close above $181.60. (37% probability)
- Scenario 3: Neutral Base-Building Range — Price chops between $148 and $182 for weeks while volatility compresses and the moving averages catch up. Trigger: repeated holds above $150 with sub-average volume. Target: $155–$172. Invalidation: close outside $146–$184. (15% probability)
PRICE TARGETS
- Target Price: $177.00 (83 days, Feb 6, 2027). This is about +8.7%, a partial retracement of the selloff that stays well below the falling moving averages.
- Expected Range: $146.00 to $192.00. Width is $46, about 28.2% of the current price, which fits the 61–180 day guidance of 18–30%.
- Key Levels: Support at $148.00 (capitulation low), Resistance at $181.60 (Nov 5 gap-down area)
OVERALL BIAS
OVERALL BIAS: BULLISH – Modest conviction. The 83-day view favors a relief rally off a capitulation low: RSI is at about 25, CMF and RSI show bullish divergences, and volume was a record. The trend is still strongly bearish (ADX 41.5, −DI 47.4, death cross pending), so gains are likely partial and capped well below the $200+ moving-average cluster.
This is educational analysis and not financial advice.