NVDA 48-day bullish forecast — Nov 15, 2026
- Bias: Bullish
- Timeframe: 48 days (made Nov 15, 2026, target date Jan 1, 2027)
- Price at analysis: $162.85
- Price target: $169.00
- Expected range: $152.00 – $181.00
- Result: Pending — graded after the close on Jan 1, 2027
Get a free AI analysis of NVDA today
Analysis
TECHNICAL INDICATORS
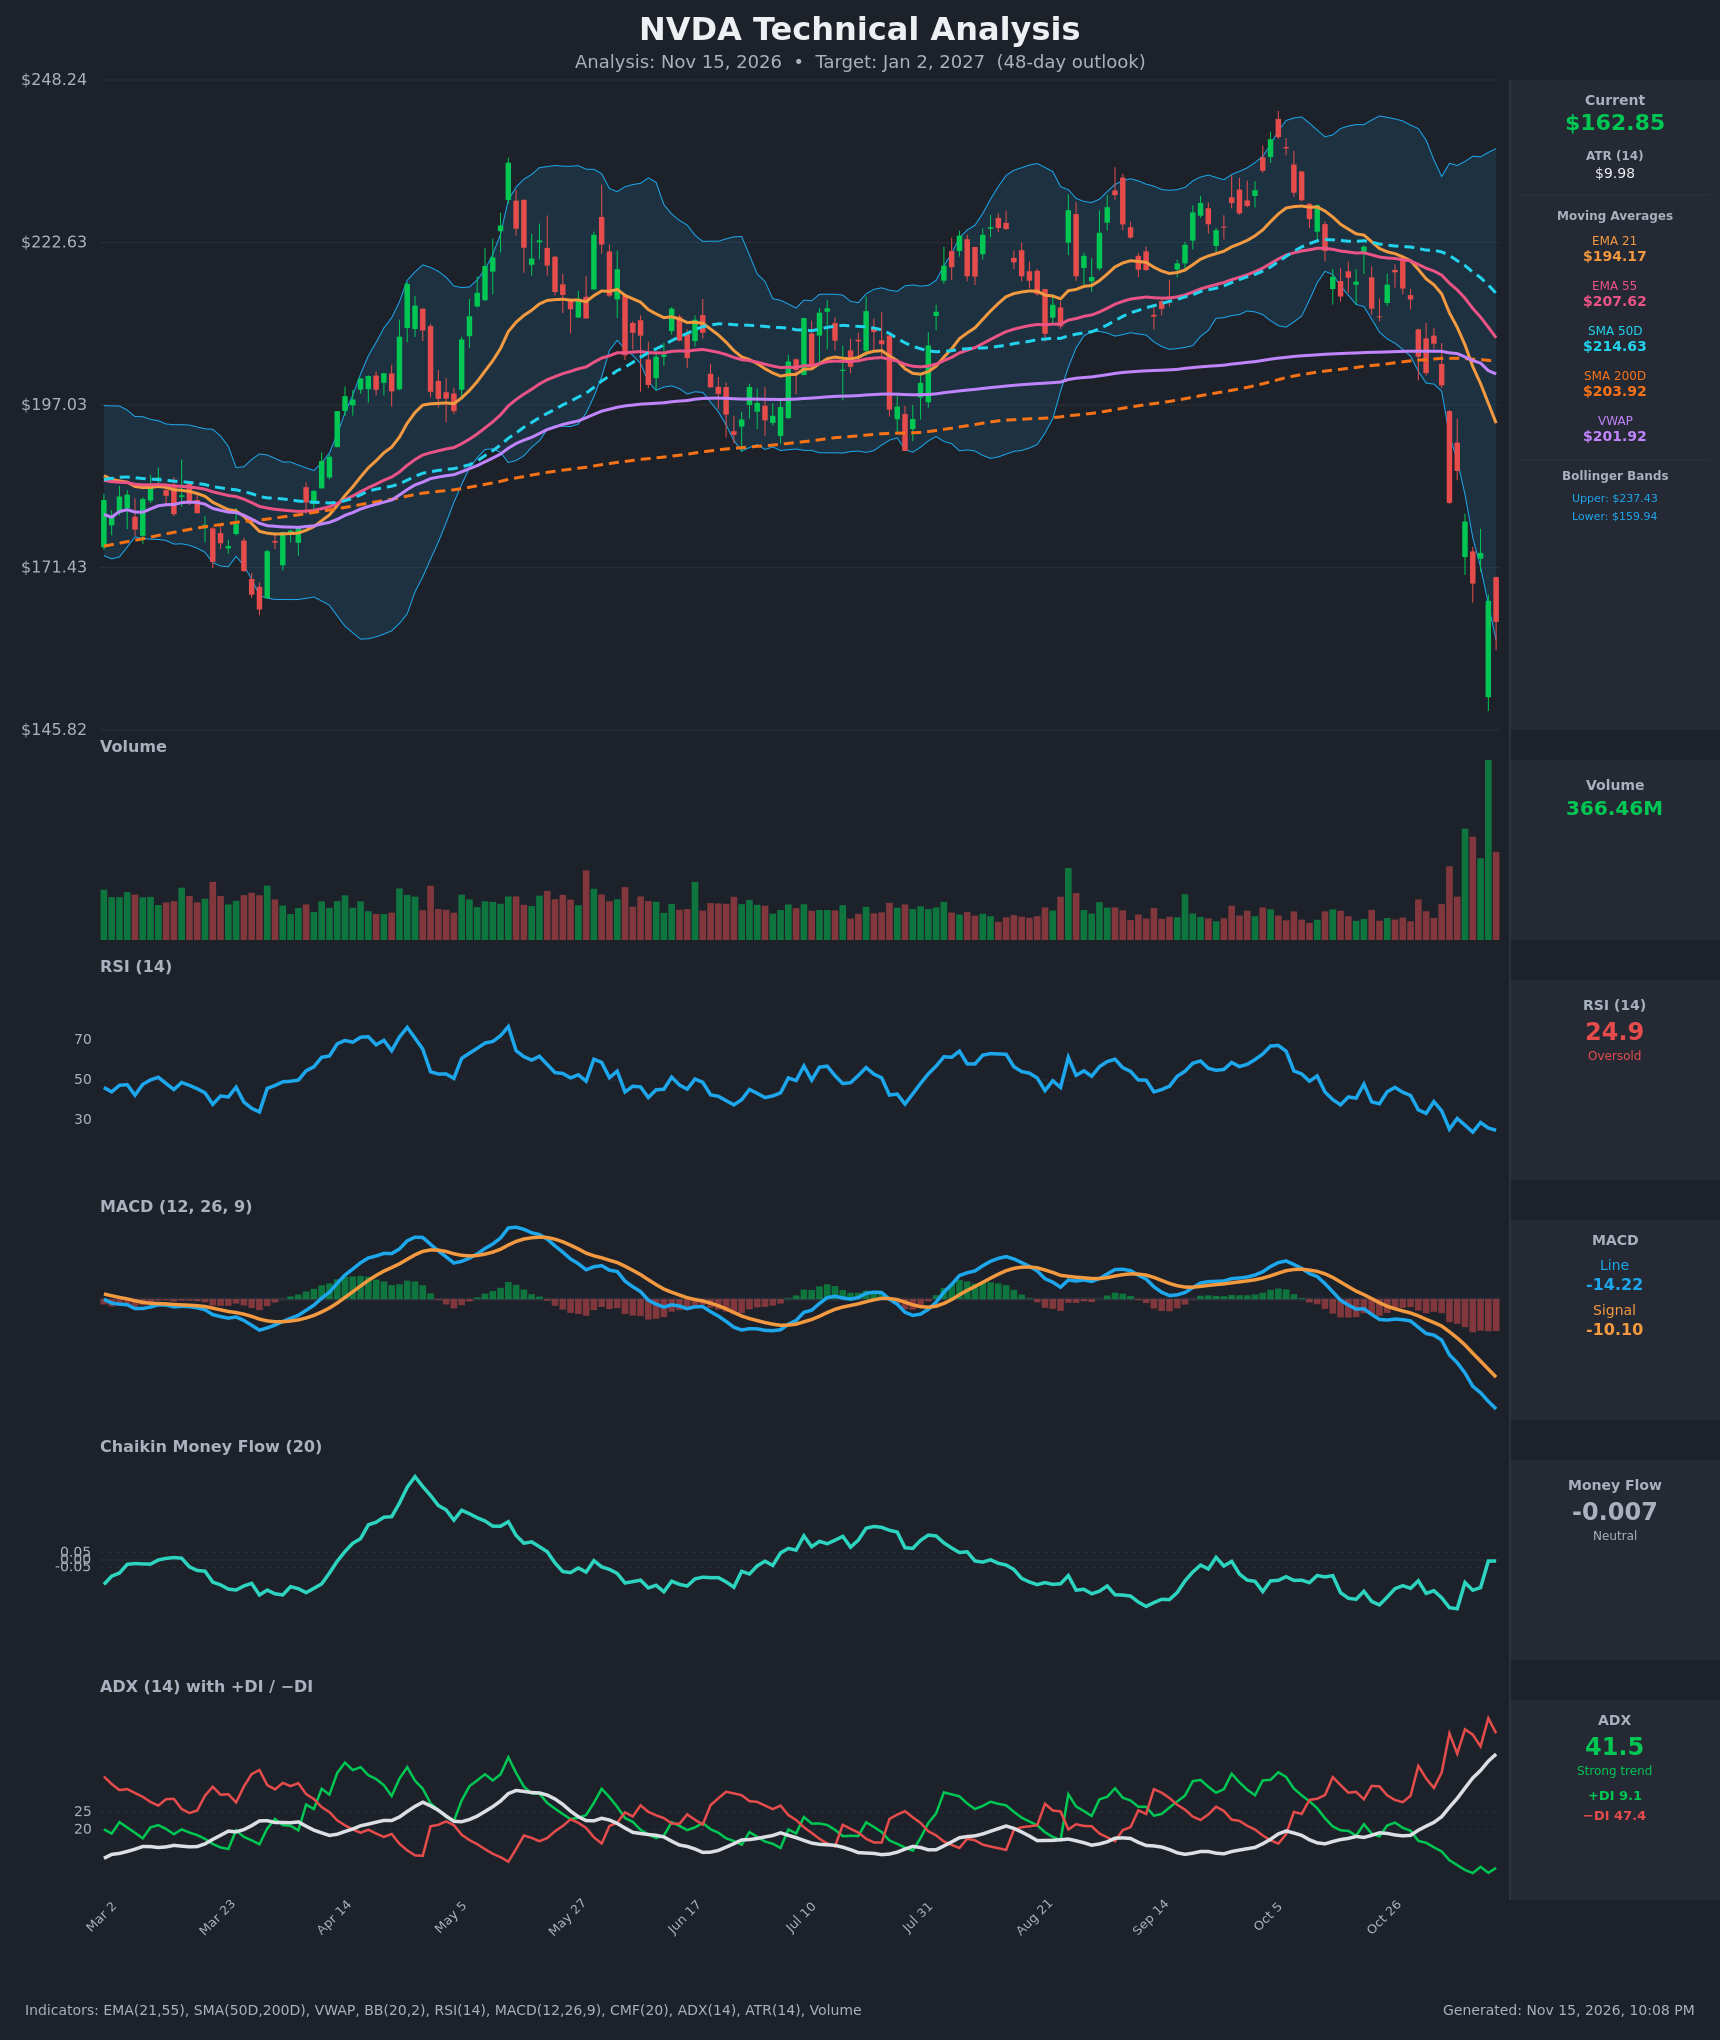
- RSI (14): 24.86, deeply oversold and near the Nov 10 low of 23.9. Momentum is still pointing down, but RSI has been below 30 for most of the last 8 sessions. That is a stretched, capitulation-type reading that often precedes a relief bounce. [Neutral]
- 20 EMA (EMA 21): $194.17, about 19% above price and falling steeply. It has crossed below the EMA 55 ($207.62), so the short-term trend structure is bearish and the EMA 21 is now overhead resistance. [Bearish]
- MACD: Line -14.22 is below signal -10.10, and the histogram is widening negative (about -4.1). The bearish cross happened weeks ago and the gap is still expanding, so there is no sign of momentum turning yet. [Bearish]
- Bollinger Bands (20): Price at $162.85 sits just above the lower band ($159.94). The intraday low pierced well below it, and the bands have expanded sharply (upper $237.43). A walk down the lower band after a volatility expansion is a strong-trend signature, but a close back near or inside the band after a spike low often marks short-term exhaustion. [Neutral]
- CMF (20): -0.007 is neutral. It has recovered from -0.33 (Nov 5-6) while price made new lows. That suggests selling pressure is fading, or that buyers absorbed the high-volume flush. [Neutral]
- ADX (14): 41.5 and rising, with −DI (47.4) far above +DI (9.1). This is a very strong downtrend, and bears are fully in control. ADX above 40 after a vertical drop can also signal a mature move close to exhaustion. [Strong Trend – Bearish]
- Volume: 366.46M, the largest spike on the chart by a wide margin, on an outsized wide-range candle with a long lower wick. This looks like a climactic or capitulation volume event. It confirms the selling was aggressive, but it also hints at a possible short-term selling climax. [Capitulation / Bearish with exhaustion potential]
DIVERGENCES & TRENDS
- CMF bullish divergence: CMF rose from about -0.33 to -0.007 while price fell from $181 to $163. This is an early sign that downside pressure is weakening.
- RSI: There is no clean divergence. RSI made 25.4 → 23.9 → 24.9 while price made lower lows, which is roughly equal lows. That is a mild "flattening" of downside momentum.
- MACD and ADX: Both are still accelerating in the bearish direction, with no divergence.
- Moving averages:
- Price is below the EMA 21, EMA 55, SMA 50D, SMA 200D and VWAP, so every trend gauge is bearish.
- The EMA 21 crossed below the EMA 55 in the last couple of weeks.
- The SMA 50D ($214.63) is falling toward the SMA 200D ($203.92). A death cross is possible within weeks, which would be a lagging bearish signal.
- Price lost the SMA 200D, which had held as support since spring.
- VWAP: Price is about 19% below VWAP ($201.92), a stretched mean-reversion setup.
- Price vs EMA 21: The distance is extreme, and rubber-band bounces from this kind of stretch are common.
CHART PATTERNS
- Bearish Double Top / failed top: Price peaked near $240 in early October after an earlier peak near $225 in May. The subsequent breakdown through the $200–205 support cluster (SMA 200D, VWAP) resembles a completed top. The measured move toward the $145–150 area is largely achieved (low about $146).
- Possible Bearish Flag / Pennant (conditional): If the next bounce is shallow and stalls below $181–$195 in a tight, downward-sloping range, it would form a bearish flag. That would project a further leg toward the low $140s.
- Gap and capitulation zone: The vertical drop with a climax-volume reversal candle is a classic selling-climax structure. Bounces to fill part of the gap ($181.60–$200) are common, but the former support at $200–$215 is now supply.
POTENTIAL SCENARIOS
- Scenario 1: Bullish Oversold Relief Bounce — The capitulation volume, RSI near 25, extreme distance from the EMAs and VWAP, and CMF recovering to neutral lead to a mean-reversion rally that partly retraces the drop. Trigger: Daily close above $172–$174 and RSI back above 40. Target: $175–$186, with an extension to the $186.64 gap area. Invalidation: Daily close below $150. (50% probability)
- Scenario 2: Bearish Trend Continuation — The ADX above 40 with −DI dominance and MACD still accelerating down means a weak bounce fails at the EMA 21 or the $181 gap, then makes a new low. Trigger: Break below $155 and then $150 on rising volume. Target: $140–$146. Invalidation: Daily close above $181.60. (35% probability)
- Scenario 3: Neutral Base-Building — Price consolidates after the climax between about $150 and $175, with volatility contracting. Trigger: Several sessions of narrow ranges and RSI hovering in the 30–45 zone. Target: $158–$170 range. Invalidation: Daily close outside $148–$178. (15% probability)
PRICE TARGETS
- Target Price: $169.00 (48-day target, about +3.8% from the current price, reflecting the weighted expectation of a partial relief bounce within a still-bearish larger trend)
- Expected Range: $152.00 to $181.00 (width $29.00, about 17.8% of current price, consistent with the 30–60 day guidance)
- Key Levels: Support at $150.00, Resistance at $181.60
OVERALL BIAS
OVERALL BIAS: BULLISH - The setup is a climactic-volume, deeply oversold flush (RSI about 25, price at the lower Bollinger Band, about 19% below the EMA 21 and VWAP) with CMF recovering to neutral, which favors a partial relief rally within 48 days. The conviction is modest because ADX, −DI and MACD still show a strong downtrend, so any bounce likely stalls well below the $194–$204 moving-average cluster.
This is educational analysis and not financial advice.