NVDA 7-day bearish forecast — Oct 31, 2026
- Bias: Bearish
- Timeframe: 7 days (made Oct 31, 2026, target date Nov 6, 2026)
- Price at analysis: $204.81
- Price target: $201.50
- Expected range: $197.00 – $210.50
- Result: Correct (-7.9%) — closed at $188.55 on Nov 6, 2026; quality score 59/100
Get a free AI analysis of NVDA today
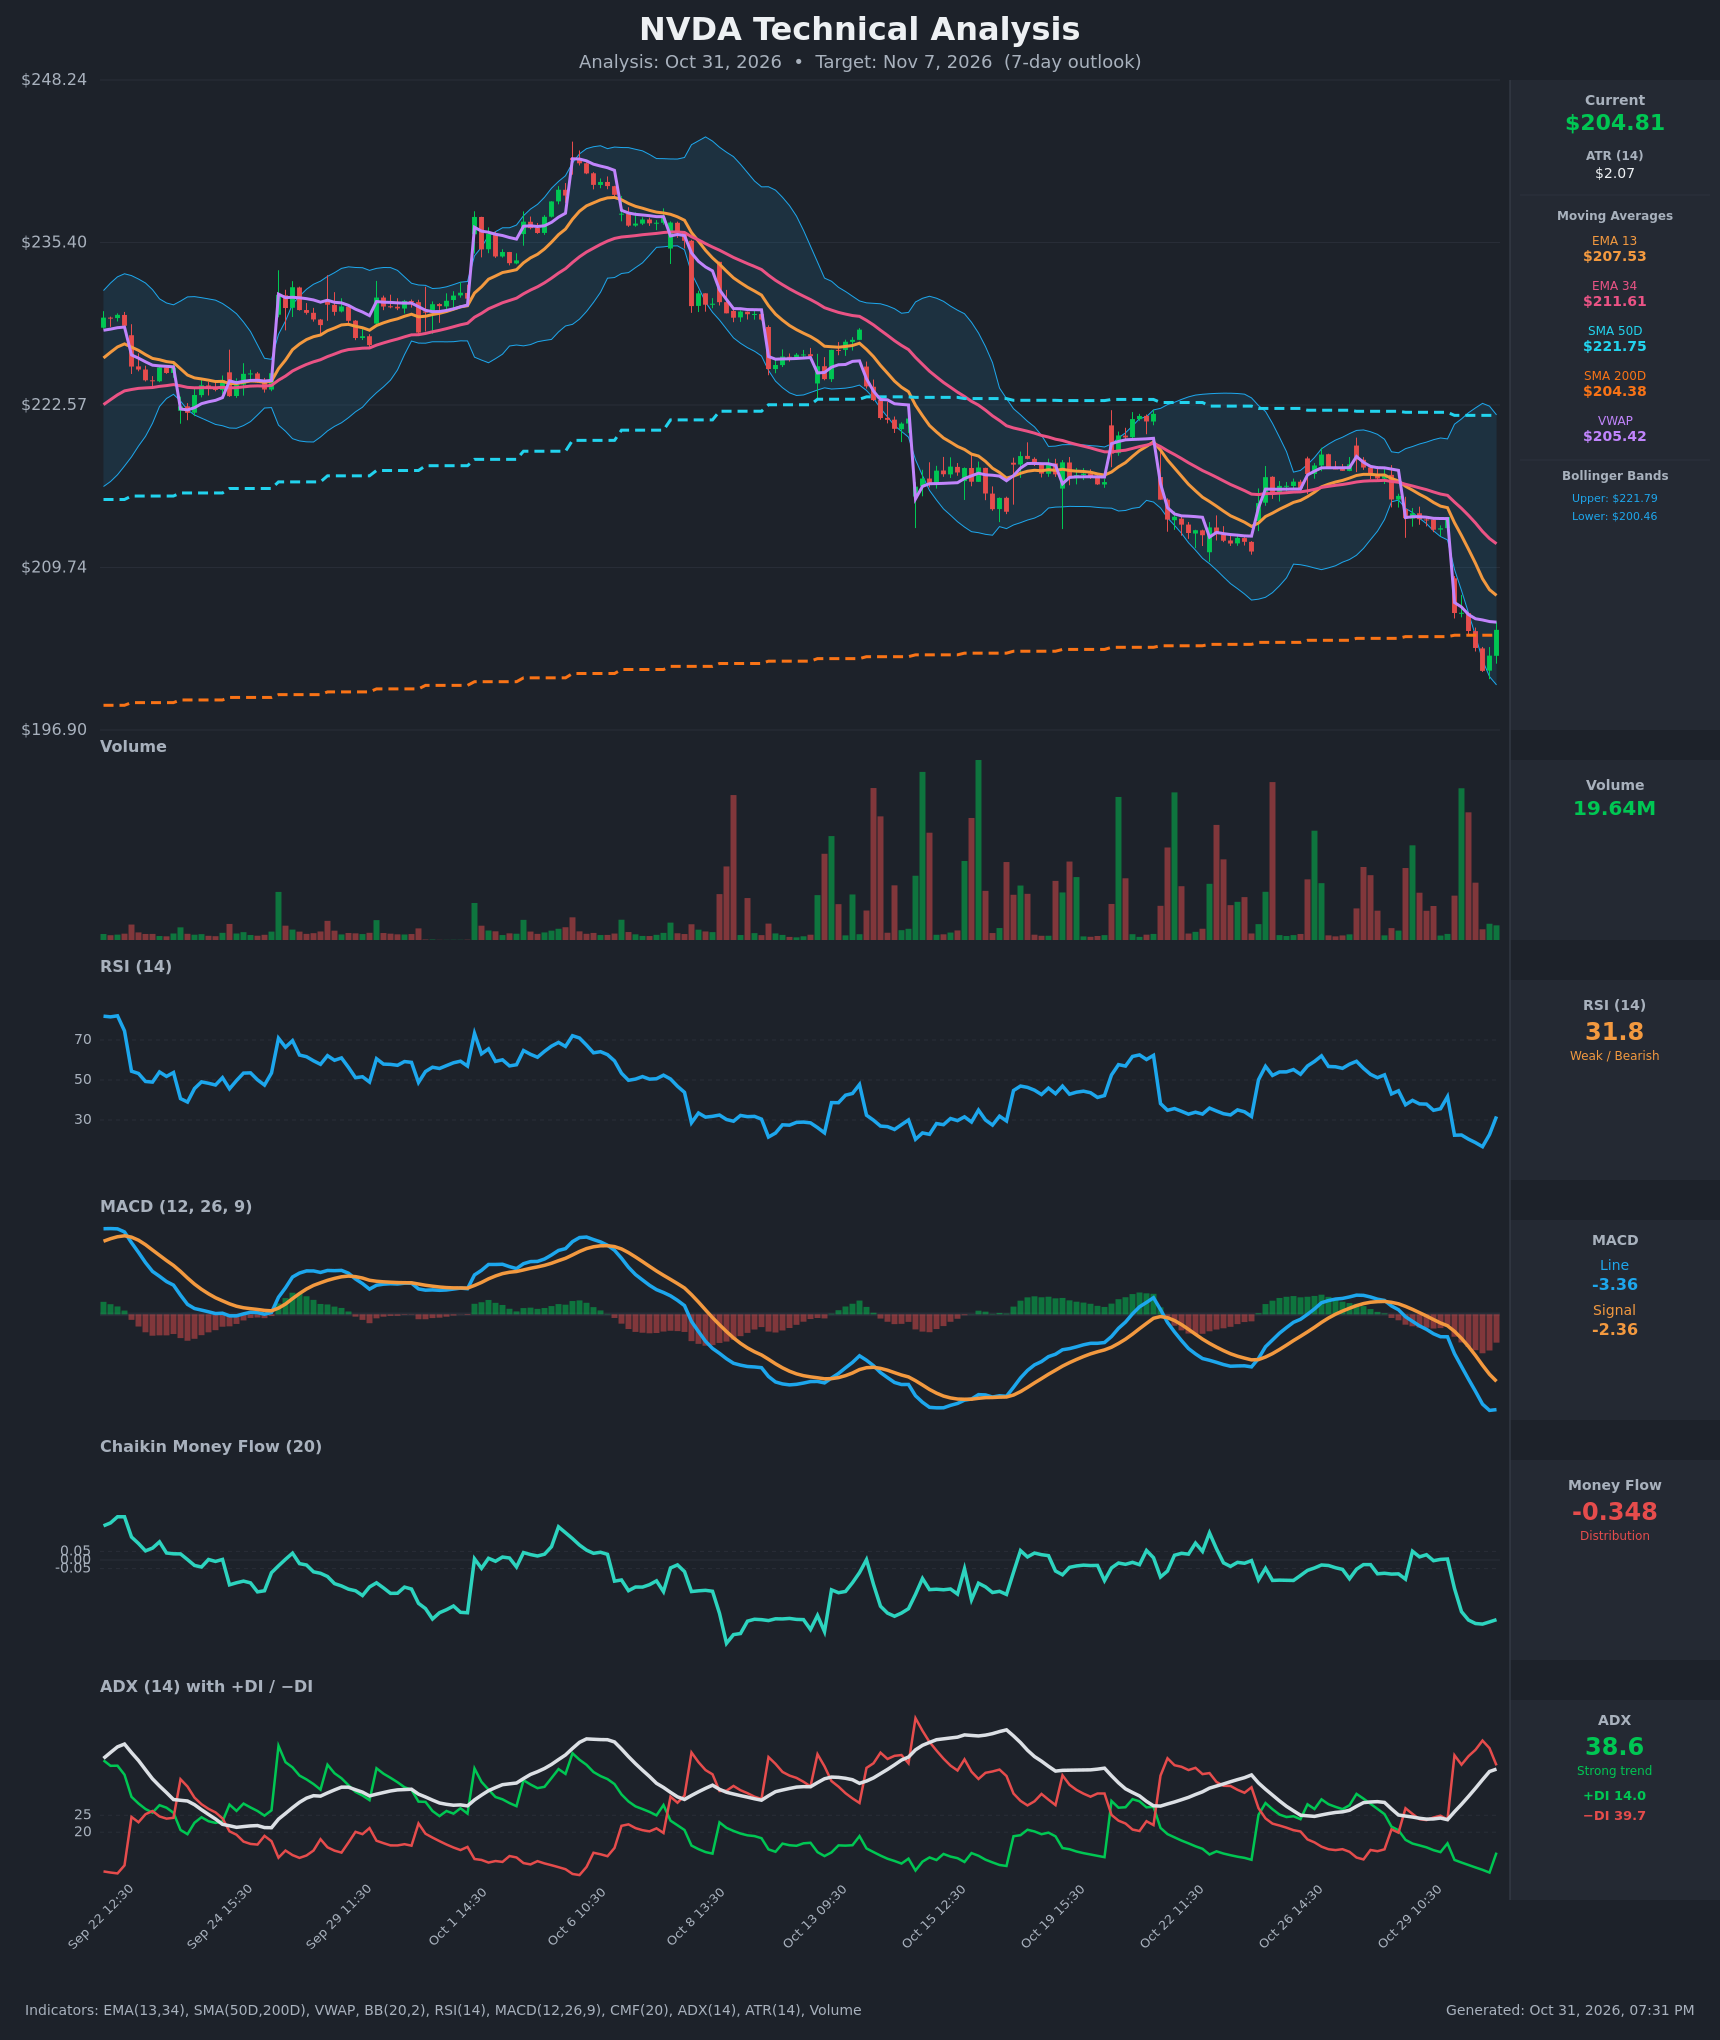
Analysis
TECHNICAL INDICATORS
- RSI (14): 31.77, bouncing from an extreme low of 16.6 on Oct 30 13:30. It is still below 40 and has not reclaimed 50, so the bounce is early and shows no trend change yet. [Bearish]
- 20 EMA: The data gives EMA 13 at $207.53 and EMA 34 at $211.61 (no 20 EMA). Price at $204.81 is below both, and both are sloping down. EMA13 is below EMA34, a bearish alignment, and the EMAs are overhead resistance. [Bearish]
- MACD: Line -3.36, signal -2.36, histogram about -1.0. The bearish crossover happened Oct 29 12:30 and the gap has widened. The line ticked up from -3.39 to -3.36, so downside momentum is flattening but not reversed. [Bearish]
- Bollinger Bands (20): Upper $221.79, lower $200.46, middle about $211. Price is in the lower quarter of the bands after a gap-down and a walk along the lower band. The bands are wide, which reflects the volatility expansion. The oversold bounce can mean-revert toward the midline, but trending markets can keep hugging the lower band. [Bearish]
- CMF (20): -0.348, deep distribution and well below -0.05. It has been negative for almost the entire window and fell sharply on the gap-down. There is no sign of accumulation yet. [Distribution]
- ADX (14): 38.6 and rising (from 23.7 two sessions ago), with -DI 39.7 far above +DI 14.0. This is a strong, established downtrend with bears firmly in control. [Strong Trend – Bearish]
- Volume: 19.64M on the latest bar, moderate compared with the heavy volume on the earlier selloff bars. The bounce is on lighter volume, which shows no conviction from buyers yet. [Neutral-to-Bearish]
Other levels:
- VWAP: $205.42, just above price. It is a marginal resistance level.
- SMA200D: $204.38. Price is sitting right on it, which makes it the key long-term support.
- SMA50D: $221.75, well overhead and flat to slightly declining.
DIVERGENCES & TRENDS
- No bullish divergence on price: RSI made an extreme low of 16.6 while price made a new low at about $201.6, so momentum and price confirmed each other. The RSI recovery to 31.8 is an oversold bounce, not a divergence.
- MACD: The bearish crossover on Oct 29 has extended. The line is now showing early flattening, which is a possible sign of momentum exhaustion.
- Moving averages: EMA13 crossed below EMA34 around Oct 24-27. Price made lower highs from the Oct 6 peak (~$242) through the Oct 22 area (~$221) and now ~$215 to $205. The 50D SMA is still above the 200D SMA, so there is no death cross yet, but the gap is narrowing.
- ADX/DI: -DI has been dominant since the Oct 30 gap. The ADX is rising, so the trend is accelerating.
- Gap risk: The gap from about $213.7 to $206.1 on Oct 30 is an unfilled overhead zone that acts as resistance.
CHART PATTERNS
- Primary pattern: a sustained descending channel of lower highs and lower lows from the Oct 6 high. It resembles a Bearish Rising Wedge / continuation breakdown structure from the reference diagram, with an extended impulsive drop on Oct 30.
- Current structure: the price is testing the SMA200D (~$204.4) and lower Bollinger Band (~$200.5). A hold here would form a base, resembling a Bullish Double Bottom only if price retests ~$201.6 and holds, which has not happened yet.
- Bearish flag potential: a weak bounce toward $207.5-$211 followed by a rollover would resemble a Bearish Flag/Pennant. The measured move of the Oct 30 drop (~$8) projects toward ~$198-$200 from a flag top near $207-$208.
POTENTIAL SCENARIOS
- Scenario 1: Bearish Trend Continuation Below SMA200D — The strong downtrend (ADX 38.6, -DI 39.7, CMF -0.35) reasserts after a weak bounce that stalls at the EMA13/VWAP/gap zone, and price breaks the SMA200D and lower Bollinger Band. Trigger: rejection at $207-$208 followed by a close below $201.60. Target: $198-$200. Invalidation: a sustained close above $211.60 (EMA34). (50% probability)
- Scenario 2: Bullish Oversold Relief Bounce — The SMA200D holds, RSI stays above 30 and rises, and price mean-reverts toward the EMAs and the gap fill. Trigger: a close above the EMA13 ($207.53) and VWAP ($205.42) with improving volume. Target: $210-$212. Invalidation: a close below $201.50. (35% probability)
- Scenario 3: Neutral Choppy Base at the 200D — Price oscillates around the SMA200D between roughly $201 and $208 while the indicators reset. Trigger: failure to break either $201.60 or $208. Target: $203-$207. Invalidation: a decisive close outside the range. (15% probability)
PRICE TARGETS
Based on ATR (about $2.07 per hourly bar across ~33 hourly bars), a typical 7-day move is about ±$10-12 at the extremes. The Expected Range width is about 6.6% of the current price, within the 4-8% guideline for a 7-day timeframe.
- Target Price: $201.50 (7-day, slightly below current price)
- Expected Range: $197.00 to $210.50 (width $13.50, about 6.6%)
- Key Levels: Support at $200.46 (lower Bollinger Band; next at ~$198), Resistance at $207.53 (EMA13; then $211.61 EMA34)
OVERALL BIAS
OVERALL BIAS: BEARISH - The strong downtrend (ADX 38.6, -DI far above +DI), deep distribution (CMF -0.35), the bearish MACD with price below all short-term EMAs, and the unfilled gap overhead outweigh the oversold RSI bounce. The SMA200D at $204.38 is the key level to watch, and a loss of it opens $198-$200.
This is educational analysis and not financial advice.