SMH 4-day bearish forecast — Oct 31, 2026
- Bias: Bearish
- Timeframe: 4 days (made Oct 31, 2026, target date Nov 3, 2026)
- Price at analysis: $522.83
- Price target: $515.00
- Expected range: $502.00 – $530.00
- Result: Correct (-1.5%) — closed at $515.20 on Nov 3, 2026; quality score 100/100
Get a free AI analysis of SMH today
Analysis
TECHNICAL INDICATORS
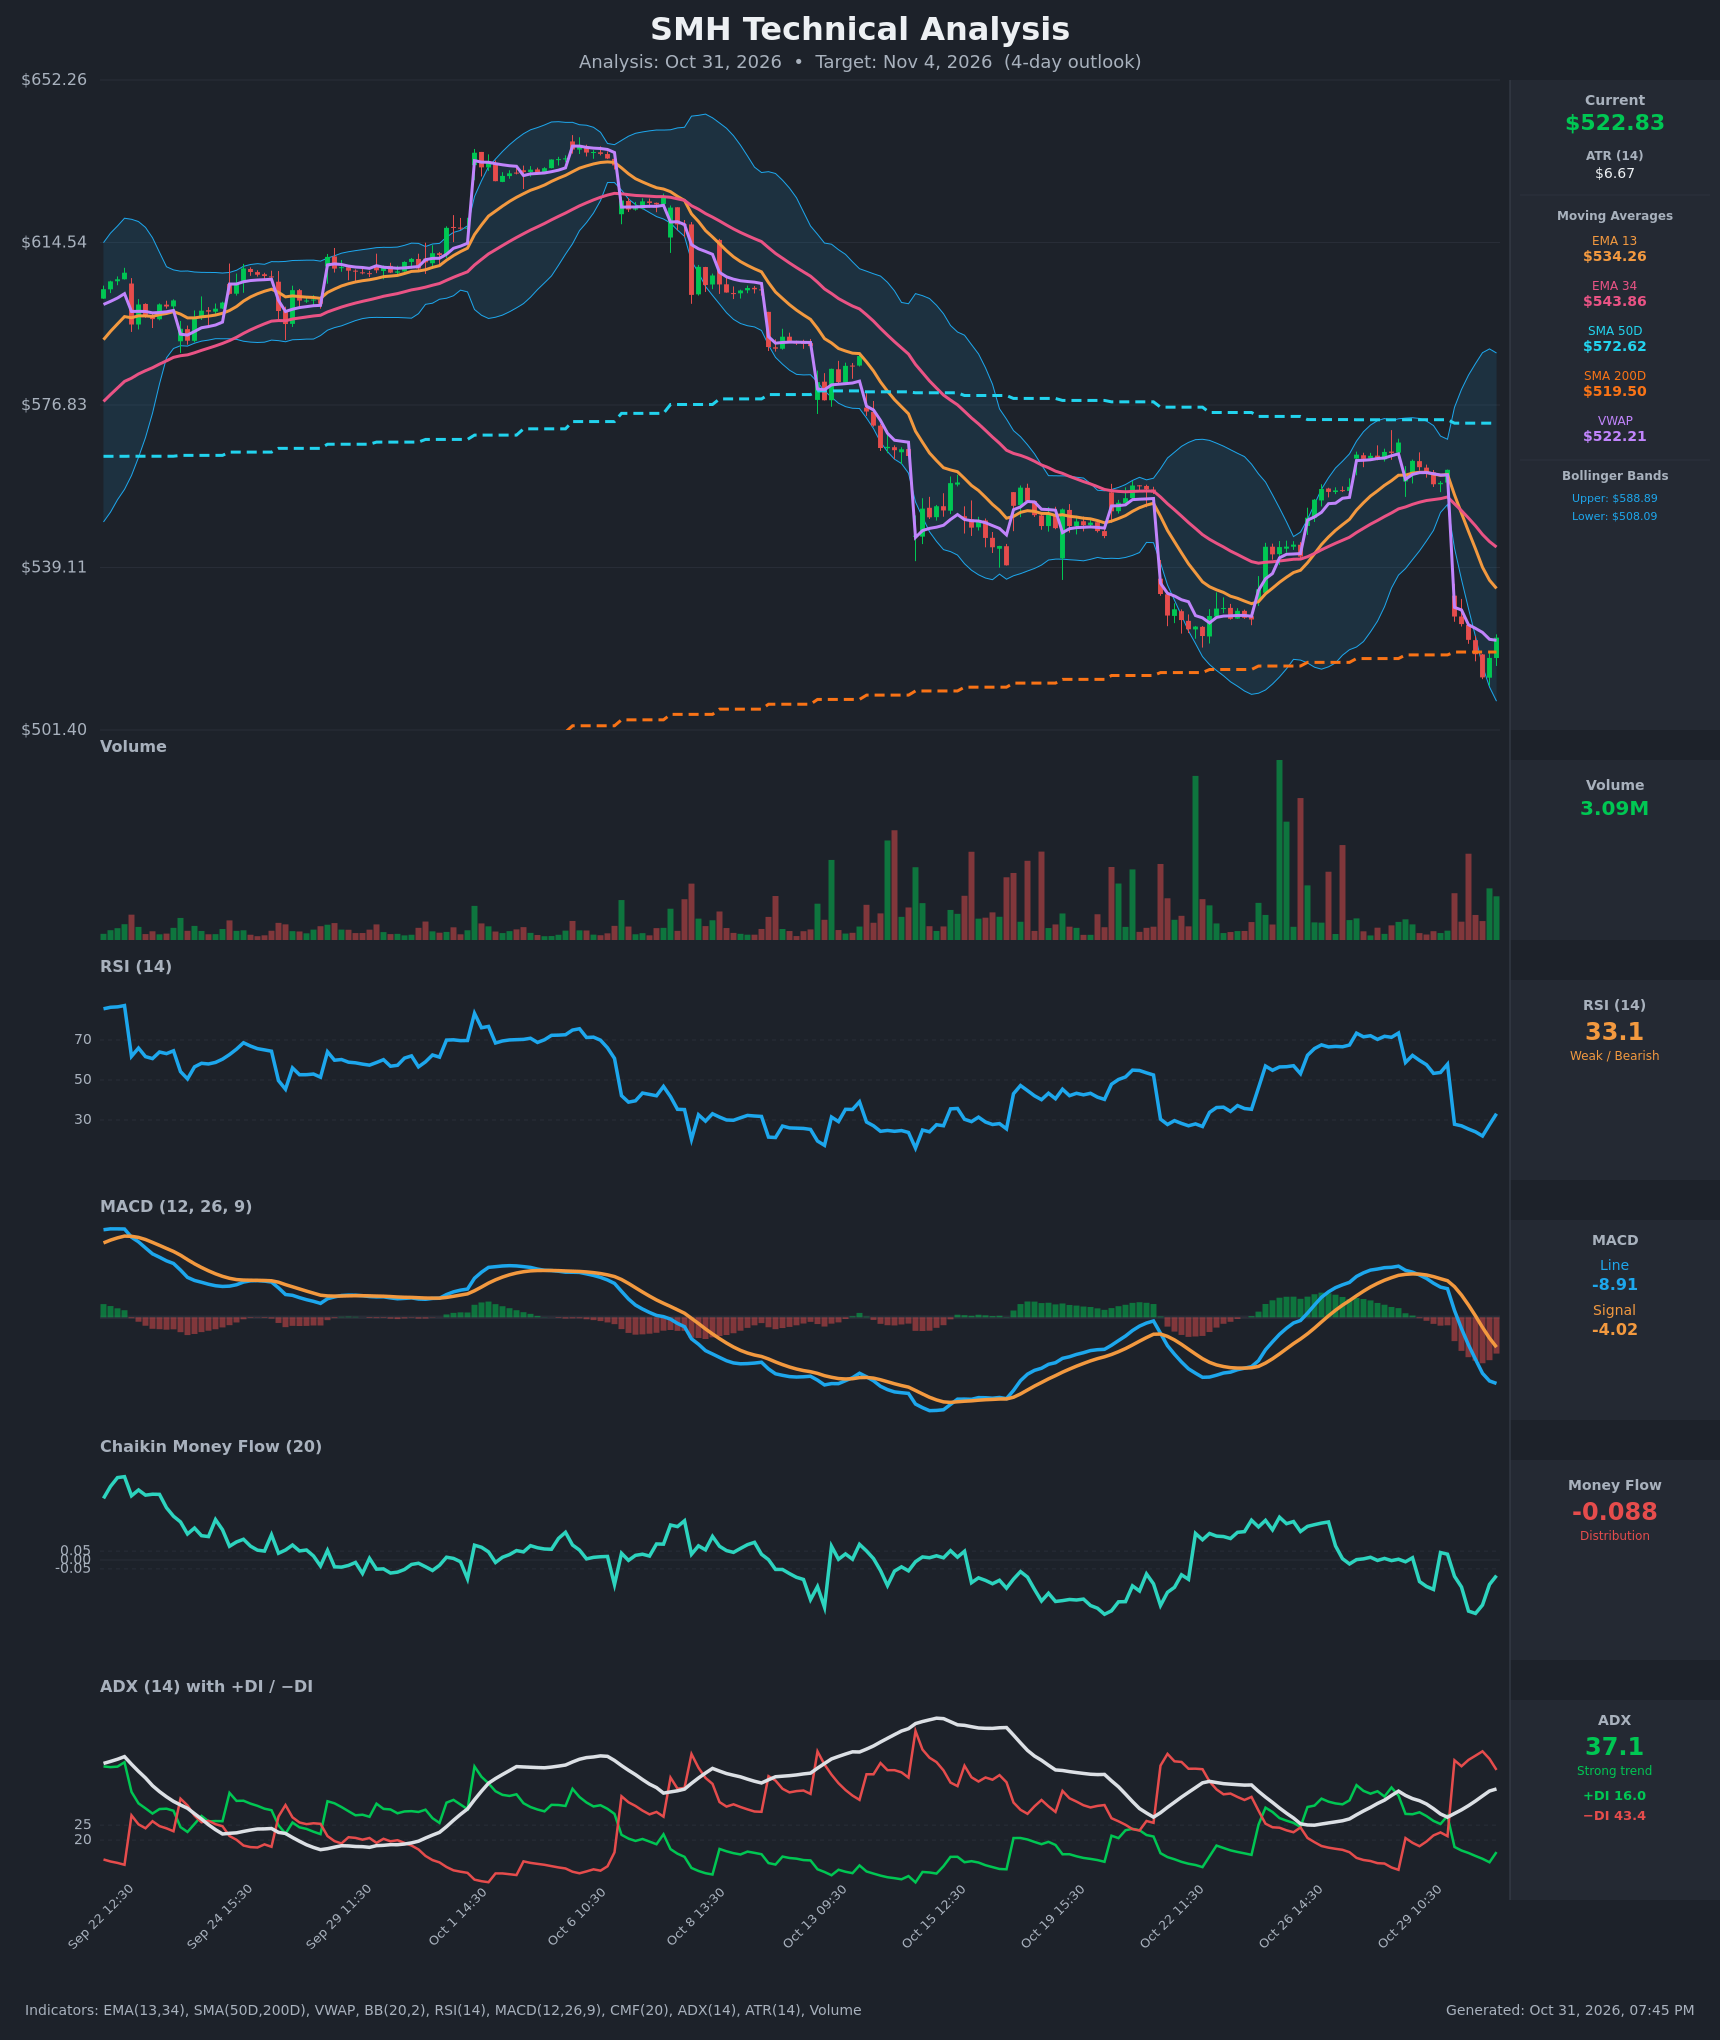
- RSI (14): 33.15, recovering from an extreme low of about 22 on Oct 30 13:30 but still below 40. The bounce is only two bars old, and the reading is just above the oversold zone, which still shows weak momentum. [Bearish]
- 20 EMA (EMA 13 / EMA 34 used): EMA13 is $534.26 and EMA34 is $543.86. Price at $522.83 is below both, and EMA13 crossed below EMA34 on Oct 30. The overhead EMAs now act as resistance, and EMA13 sits about 2.2% above price. [Bearish]
- MACD: Line -8.91 is below Signal -4.02, a gap of about -4.9. The line crossed below the signal on Oct 30 10:30 and has gone below zero. The histogram is deeply negative and still expanding, though the rate of decline is slowing. [Bearish]
- Bollinger Bands (20): Upper $588.89, lower $508.09. The bands are very wide after the gap. Price sits in the lower third, about $15 above the lower band, and only 2 bars ago was hugging it. The pullback reached the lower band and bounced, but there is no band-walk confirmation yet. [Neutral]
- CMF (20): -0.088, below the -0.05 threshold, so selling pressure is dominant. It dipped to about -0.30 and has improved to -0.088, so the distribution is easing but not yet reversed. [Distribution]
- ADX (14): 37.1 and rising, a strong trend. −DI at 43.4 is far above +DI at 16.0, so bears are firmly in control. The ADX is rising because of the downside move. [Strong Trend – Bearish]
- Volume: 3.09M on the latest bar, moderate compared with the heavy spikes earlier in the chart. The gap-down bars carried elevated volume (distribution), while the bounce is on average volume, so buyers are not showing conviction. [Mildly Bearish – bounce lacks volume]
Other levels: VWAP is $522.21, so price is right at VWAP and balanced there. SMA200 at $519.50 is only 0.6% below price and is the key long-term support. SMA50 at $572.62 is well above price and has been flat to slightly falling. No death cross has occurred yet, since SMA50 is still above SMA200.
DIVERGENCES & TRENDS
- No clear bullish divergence exists yet. RSI made a very low reading (~22) with the price low, and the subsequent bounce has not made a higher low in price. Price made a new low at $513.61 and RSI at 22, so momentum and price are confirming.
- The Oct 30 session opened with a roughly 6% gap down, from $561.78 to $527.73. RSI collapsed from 58 to 28 and MACD fell from +3.9 to -8.9 within hours. This is a sharp momentum break, not a gradual decline.
- The trend structure is bearish: lower highs (~$640 → ~$570 on Oct 28) and a drop back to the SMA200. The Oct 28 rally attempt failed below SMA50.
- Crossovers are bearish: EMA13 below EMA34, MACD below signal and zero, and −DI far above +DI.
- Supporting a bounce: RSI turned up from 22 to 33, CMF is improving, and price reclaimed SMA200 and VWAP on the final bar. A dead-cat bounce toward EMA13 around $534 is possible before sellers return.
CHART PATTERNS
- There is no clean textbook reversal. The closest fit is a bearish continuation structure: a failed rally (lower high near $570) followed by a gap breakdown. It resembles a loose descending-triangle / lower-high breakdown. Its support is the SMA200 area near $519.50, and a loss of it would open the lower Bollinger Band at $508.
- A Bullish Double Bottom is only a speculative possibility if price retests ~$513–515 and holds. It is not confirmed, because the bounce so far is only two hourly bars.
- The measured target for a decisive break below $513.61 points toward roughly the $500 area, close to the bottom of the chart range ($501).
POTENTIAL SCENARIOS
- Scenario 1: Bearish Continuation Lower — the gap-down momentum resumes after a weak bounce fails at the EMA13/VWAP area, and price breaks the SMA200 and retests the Oct 30 low. Trigger: hourly close below $519.50 (SMA200) and below $513.61. Target: $508 (lower BB), extended to $502. Invalidation: hourly close above $534 (EMA13). (50% probability)
- Scenario 2: Bullish Oversold Relief Bounce — RSI turns up from deeply oversold, SMA200 holds as support, and price mean-reverts toward EMA13 and the gap-fill zone. Trigger: close above $528–530 with improving volume and CMF turning above 0. Target: $534–$544 (EMA13/EMA34). Invalidation: close below $513.61. (32% probability)
- Scenario 3: Neutral Consolidation on the SMA200 — price chops between $513 and $530 while indicators reset. Trigger: failure to break either $513.61 or $530. Target: $520–$526. Invalidation: close outside the $513–$530 range. (18% probability)
PRICE TARGETS
- Target Price: $515.00 (4-day horizon, Nov 4, 2026)
- Expected Range: $502.00 to $530.00 (width $28.00 ≈ 5.4% of current price, which fits a 4-day window: wider than a 2–3 day range and tighter than a 7–10 day range)
- Key Levels: Support at $519.50 (SMA200), with the next support at $508.09 (lower BB); Resistance at $534.26 (EMA13), with $543.86 (EMA34) above it.
OVERALL BIAS
OVERALL BIAS: BEARISH - A strong, rising ADX (37) with −DI at 43 versus +DI at 16, a bearish MACD cross, EMA13 below EMA34 and persistently negative CMF all favor continuation lower. The oversold bounce is real but unconfirmed, and a break of the SMA200 at $519.50 would open the lower Bollinger Band near $508.
This is educational analysis and not financial advice.