SMH 62-day bearish forecast — Nov 15, 2026
- Bias: Bearish
- Timeframe: 62 days (made Nov 15, 2026, target date Jan 15, 2027)
- Price at analysis: $486.75
- Price target: $462.00
- Expected range: $395.00 – $540.00
- Result: Pending — graded after the close on Jan 15, 2027
Get a free AI analysis of SMH today
Analysis
TECHNICAL INDICATORS
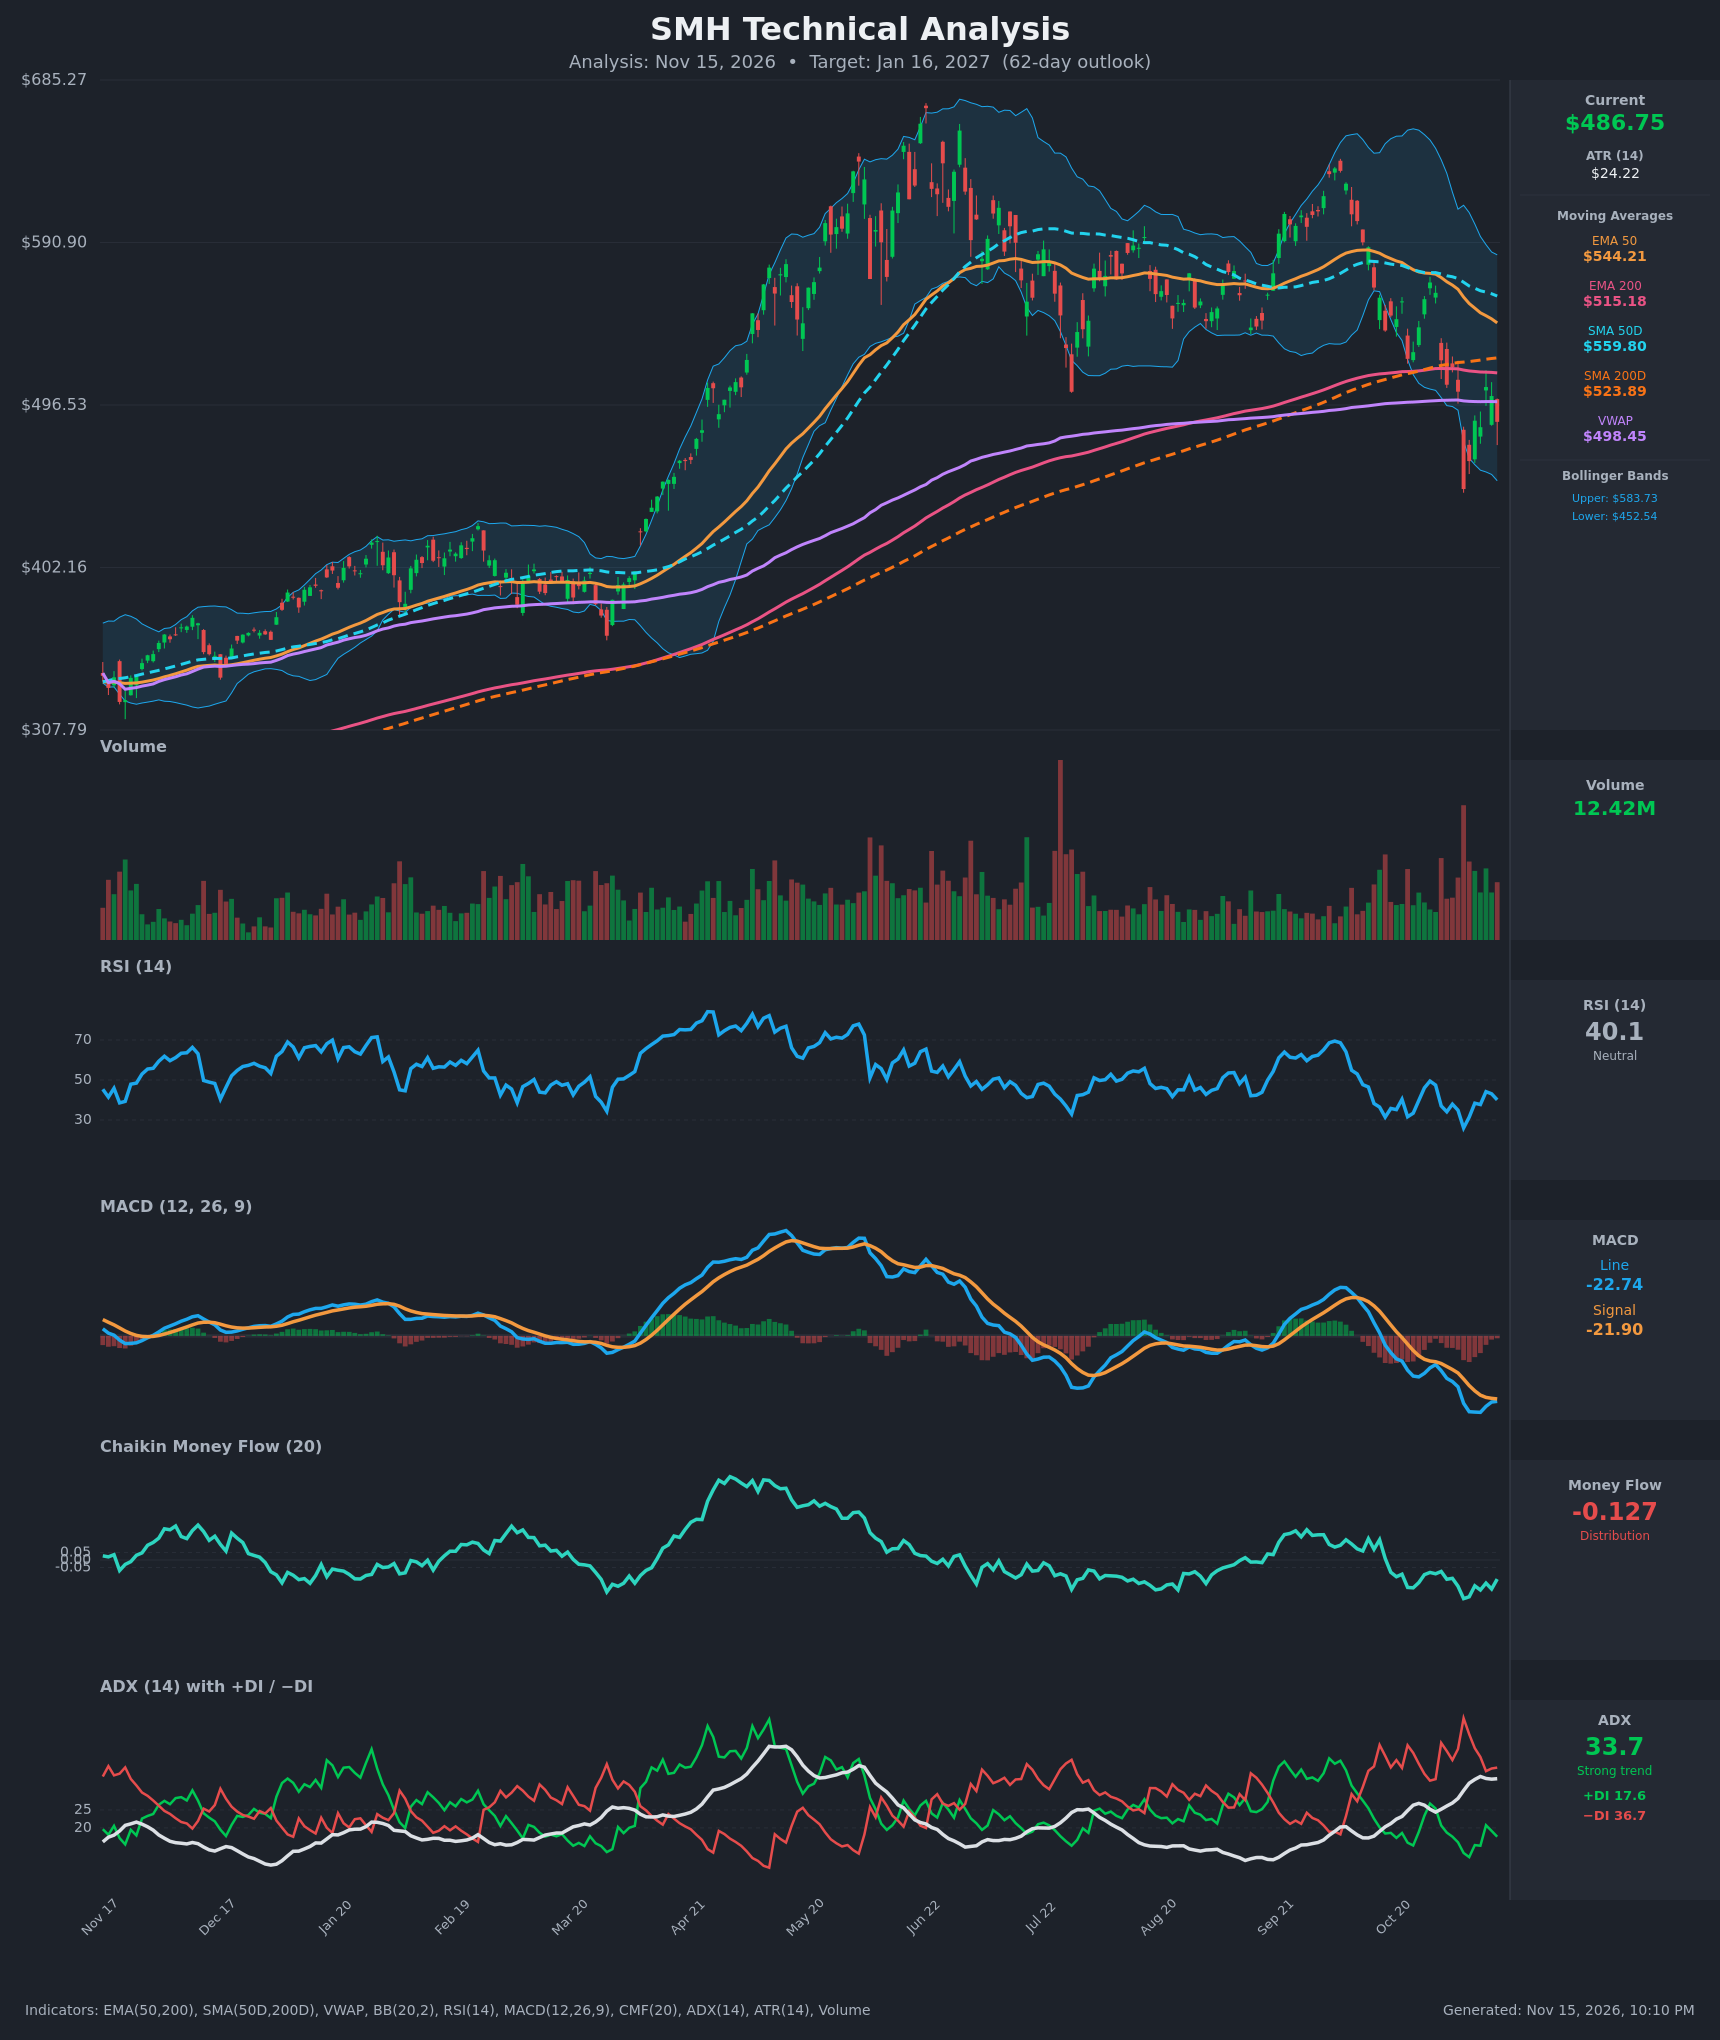
- RSI (14): 40.08, below the 50 midline and recovering only slightly from the oversold reading of 26.0 on Nov 5. Momentum is weak, with lower highs in RSI since the September peak. [Bearish]
- 20 EMA: The 20 EMA is not provided. The EMA 50 at $544.21 is sloping down and well above price, so it acts as overhead resistance. Price is about 10.6% below it. [Bearish]
- MACD: Line at -22.74 sits just below the signal at -21.90, with a small negative histogram. The line has been below the signal since Oct 30. The histogram is shrinking, which hints at selling momentum fading, but there is no bullish crossover yet. [Bearish]
- Bollinger Bands (20): Upper band $583.73, lower band $452.54, midline about $518. Price at $486.75 is in the lower half of the bands, below the midline. It bounced off the lower band on Nov 5 ($447.73), so the squeeze-down move has partly reverted. [Bearish]
- CMF (20): -0.127, below -0.05 and negative for most of the past several months. The reading is distribution, with no sign of accumulation on the bounces. [Distribution]
- ADX (14): 33.7 with −DI at 36.7 and +DI at 17.6. ADX has risen from the low 20s, so a strong trend is in place and bears are clearly in control. [Strong Trend – Bearish]
- Volume: 12.42M, with heavy red volume on the Nov 5 breakdown flush (one of the largest bars in months). The subsequent bounce came on moderate volume, which suggests weak conviction among buyers. [Bearish-leaning]
DIVERGENCES & TRENDS
- Moving average structure: Price sits below the EMA 50 ($544.21), SMA 50D ($559.80), EMA 200 ($515.18) and SMA 200D ($523.89). Losing the 200-day averages is a significant long-term trend break.
- Possible death cross: The SMA 50D at $559.80 is still above the SMA 200D at $523.89, but the gap is narrowing by about $1.50 to $2 per day on the recent data. The EMA 50 is also converging on the EMA 200. A death cross could form in the next 4-6 weeks if the decline continues.
- VWAP: Price is below VWAP ($498.45), which is a sign of selling pressure.
- Momentum: RSI made a lower high in the September rally relative to the June peak, and the MACD peak was lower in September than in April-June. This is a bearish momentum divergence that preceded the current drop.
- Short-term: There is a mild bullish divergence from the Nov 5 low. RSI rose from 26 to about 40, and the MACD histogram is contracting. This favors a relief bounce rather than a trend reversal.
- Trend: The price high near $685 in June was followed by lower highs, with a September high near $640, and now a break below the 200-day averages.
CHART PATTERNS
- Bearish Head and Shoulders (developing): The June peak (~$685) is the head. The July low (~$510) and the October low (~$450) are broadly consistent with a neckline near $500-$520. The price has broken below this area, and the September rally (~$640) looks like the right shoulder. The measured move is the head-to-neckline distance (~$170), which projects well below $400. The pattern is not fully clean, so this is a longer-range risk rather than my base case.
- Bearish Rising Wedge / Flag characteristics: The recent bounce from $447 to $507 is a corrective, low-volume rally inside a downtrend, which fits a bearish flag. A breakdown below $447 would target the low $400s.
- Resistance cluster: The $515-$524 area (EMA 200, SMA 200D) is now resistance after the break, with VWAP at $498 just overhead. A rally into this zone that fails would confirm the breakdown.
POTENTIAL SCENARIOS
- Scenario 1: Bearish Trend Continuation — Price fails at the $498-$524 resistance cluster (VWAP, EMA 200, SMA 200D), retests the Nov 5 low and breaks it as the −DI-led trend continues. Trigger: daily close below $447 or a rejection at $515-$524. Target: $415-$440. Invalidation: daily close above $545 (EMA 50). (50% probability)
- Scenario 2: Neutral Choppy Base Between $450 and $525 — The Nov 5 low holds, price oscillates between support and the 200-day averages as the selloff exhausts, and ADX fades. Trigger: repeated holds of $450-$460 with RSI staying 35-55. Target: $470-$510. Invalidation: close outside $440-$530. (22% probability)
- Scenario 3: Bullish Relief Rally and Recovery — Oversold bounce reclaims the 200-day averages and VWAP, and MACD crosses up. Trigger: close above $524 with improving CMF. Target: $545-$560 (EMA 50 / SMA 50D). Invalidation: close back below $487 after the breakout. (28% probability)
PRICE TARGETS
- Target Price: $462.00 (62-day, Jan 16, 2027)
- Expected Range: $395.00 to $540.00 (width $145, about 29.8% of the current price, in line with the 18-30% guidance for 61-180 days)
- Key Levels: Support at $447.73 (Nov 5 low), Resistance at $515.18 (EMA 200, with the SMA 200D at $523.89 just above)
OVERALL BIAS
OVERALL BIAS: BEARISH - Price has broken below both 200-day averages and VWAP, −DI dominates +DI (36.7 vs 17.6) with a rising ADX of 33.7, CMF shows persistent distribution, and MACD remains below its signal. The recent bounce looks like a low-conviction relief rally into overhead resistance at $515-$524.
This is educational analysis and not financial advice.