SMH 83-day bearish forecast — Nov 15, 2026
- Bias: Bearish
- Timeframe: 83 days (made Nov 15, 2026, target date Feb 5, 2027)
- Price at analysis: $486.75
- Price target: $465.00
- Expected range: $415.00 – $535.00
- Result: Pending — graded after the close on Feb 5, 2027
Get a free AI analysis of SMH today
Analysis
TECHNICAL INDICATORS
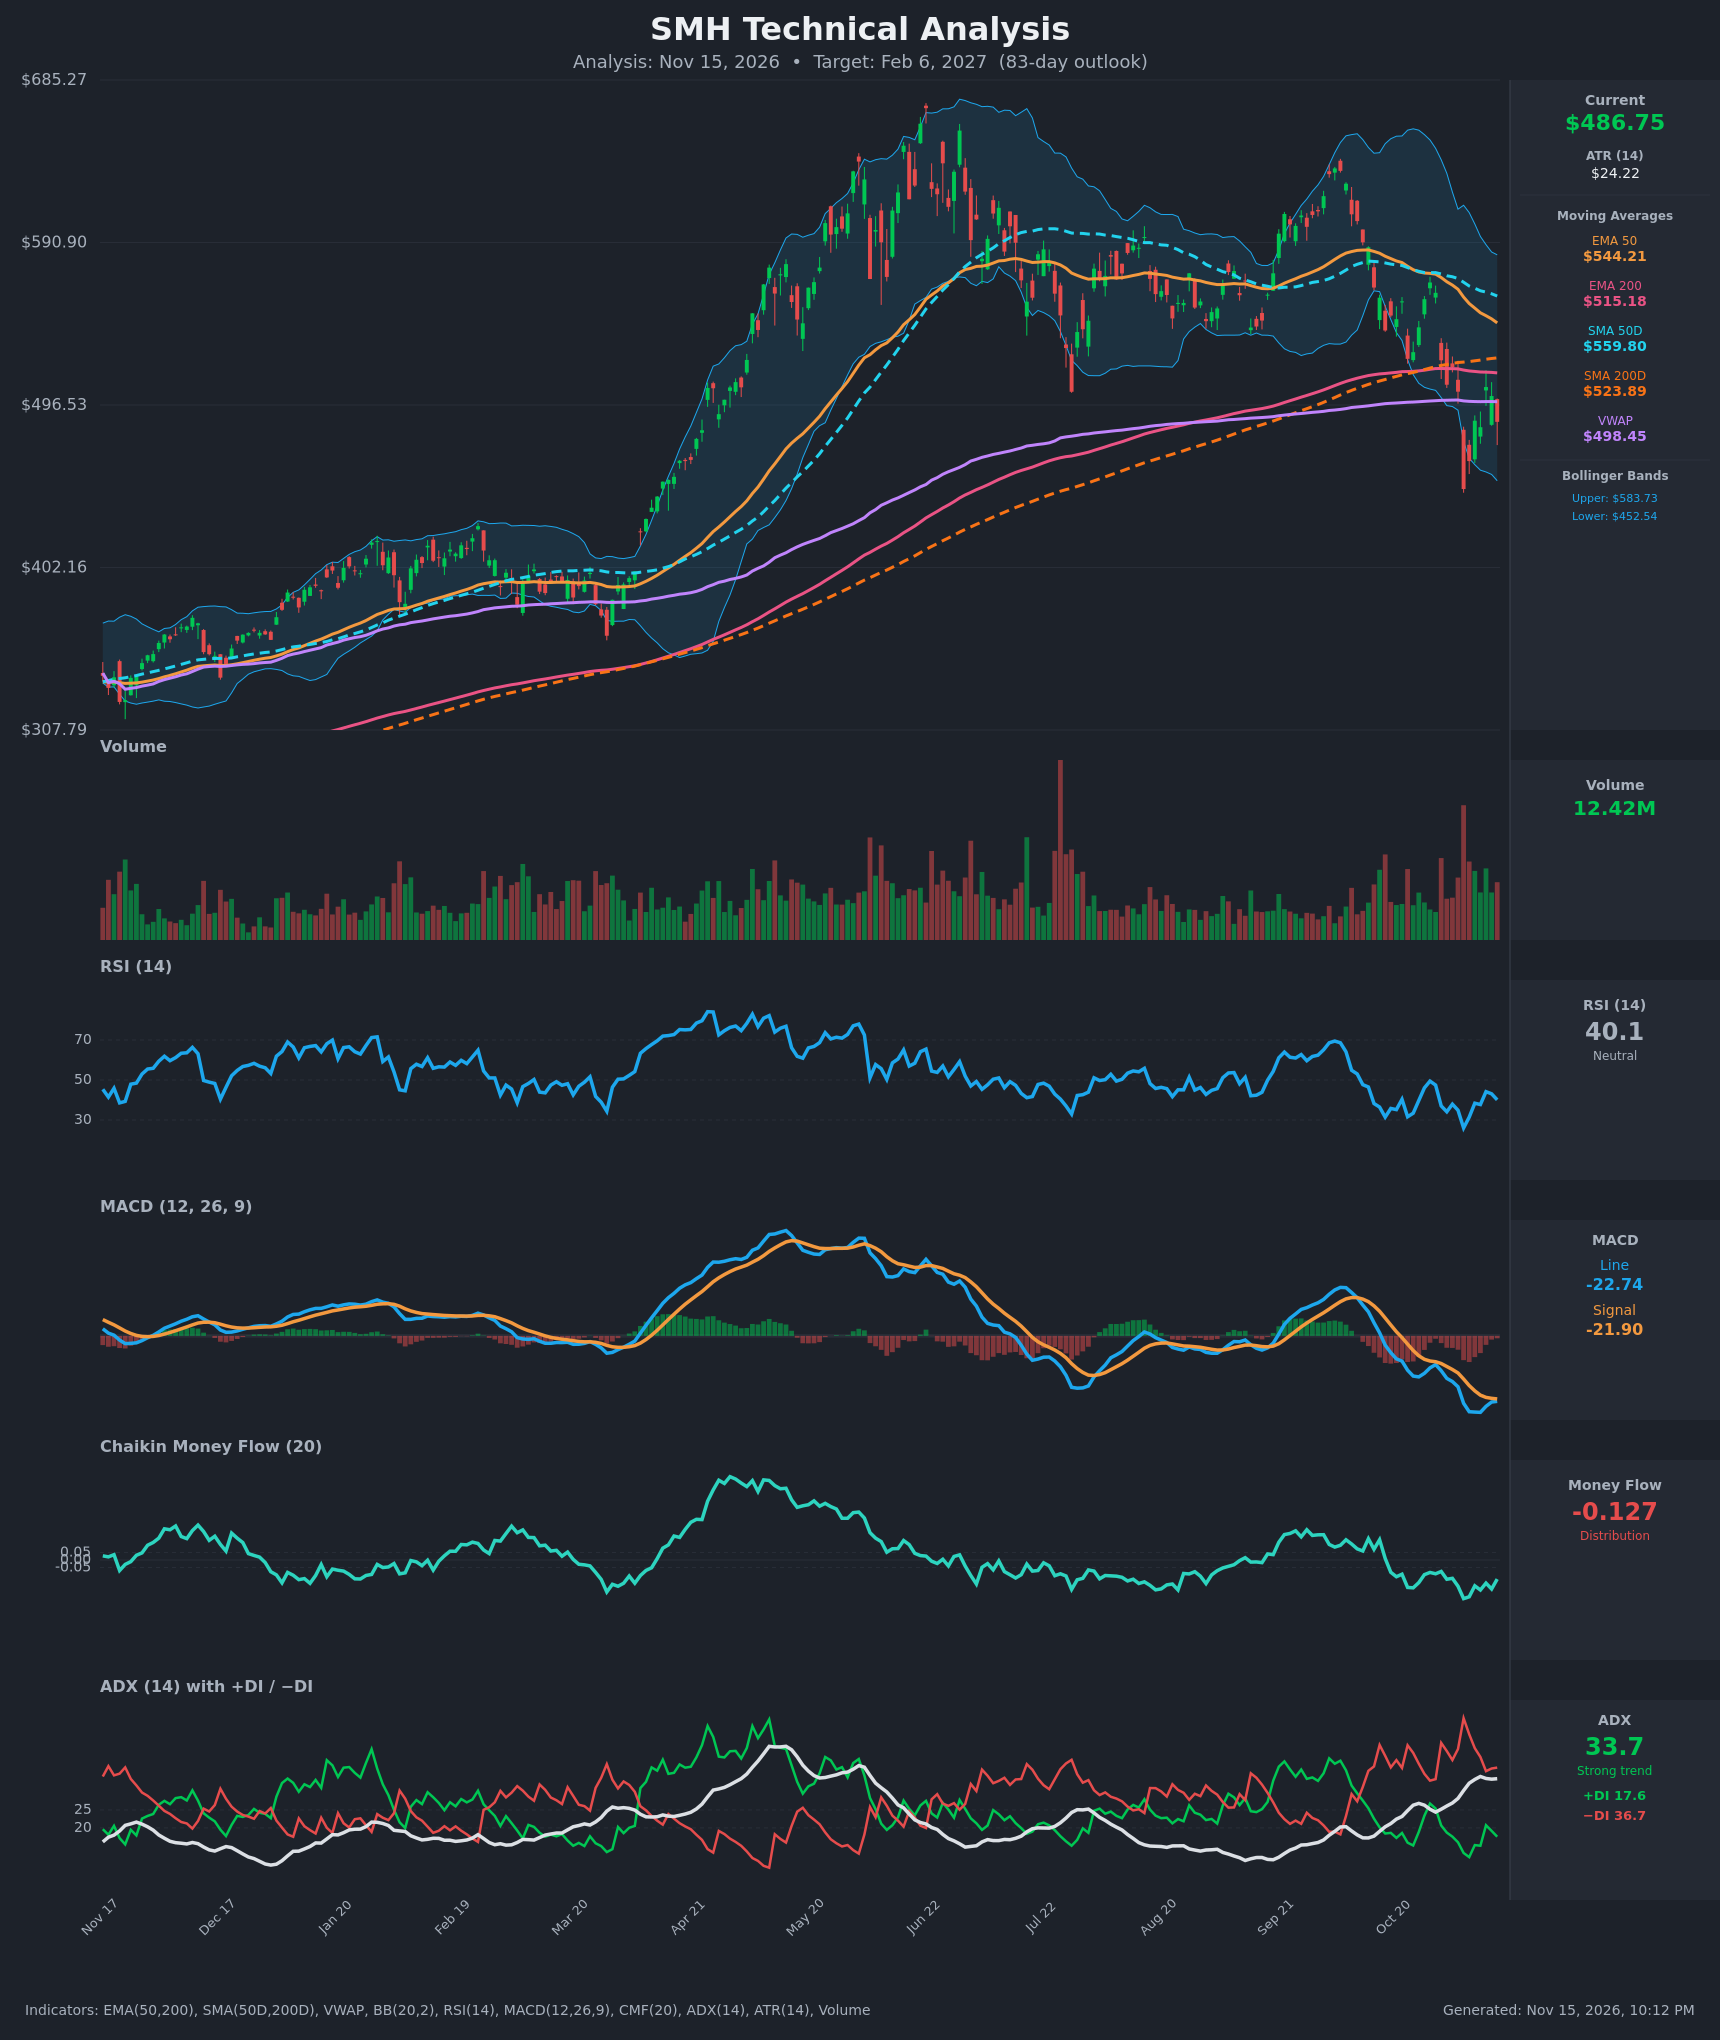
- RSI (14): 40.08, below the 50 midline after bottoming at 26.0 on Nov 5 (oversold). It bounced to 44 and has rolled over again. The lower highs (49 → 44) show weak momentum, not yet oversold. [Bearish]
- 20 EMA: The chart has no 20 EMA, so the EMA50 serves as the proxy at $544.21. Price at $486.75 is about 10.5% below it, and the EMA50 is falling steadily (from $573.79 over 15 bars), so it acts as overhead resistance. [Bearish]
- MACD: Line -22.74 sits just below signal -21.90, with a negative histogram of about -0.84. The line is deeply negative and the histogram is narrowing slightly, so downside momentum is easing but there is no bullish crossover yet. [Bearish]
- Bollinger Bands (20): Upper $583.73, lower $452.54, mid about $518. Price sits in the lower half, below the midline, after a Nov 5 close below the lower band ($447.73). Bands are wide, showing elevated volatility. The bounce off the lower band has not reclaimed the mid-band. [Bearish]
- CMF (20): -0.127, well under -0.05 and persistently negative since late October (low of -0.258). This is sustained distribution. [Distribution]
- ADX (14): 33.7 and rising (from 24.4), so the trend is strong. -DI 36.7 is far above +DI 17.6, which means bears are firmly in control. [Strong Trend – Bearish]
- Volume: 12.42M, with a heavy volume spike on the Nov 5 breakdown (the largest red bar of the recent period). Selling volume has outweighed buying on the declines. [Bearish distribution, with possible capitulation near the Nov 5 low]
Other levels:
- VWAP: $498.45 sits above price, so it is now resistance.
- EMA200 / SMA200D: $515.18 / $523.89 are above price, so price has lost the long-term trend support.
- Cross status: SMA50D at $559.80 is above SMA200D (no death cross yet), but the gap has narrowed from about $58 to $36. A death cross is possible within the 83-day window.
DIVERGENCES & TRENDS
- There is no clear bullish divergence. Price made a lower low on Nov 5 ($447.73), and RSI made a low (26.0) at the same time. Subsequent RSI highs are lower (49.4 → 44.2), which is bearish.
- MACD is at its lowest level of the year and is deepening below zero. Its line sits below the signal line, though the gap is narrowing (about -0.8).
- The moving averages are rolling over. EMA50 and SMA50D are both declining, and price is below all of the EMA50, EMA200, SMA50D, SMA200D and VWAP.
- ADX has risen above 30 with -DI dominating, confirming a strong downtrend. The -DI at 36.7 is close to its yearly high.
- CMF has stayed below -0.05 for most of the past two months, so distribution has persisted.
- The Nov 5 flush to $447.73 came with a volume spike and a close below the lower Bollinger Band. This was a short-term washout, and price has since stabilized in the $480-$510 range.
CHART PATTERNS
- The price has made a lower high (September peak ~$625 vs the June peak ~$670) followed by a break below the EMA200 and SMA200D. This is consistent with a Bearish Double Top (or a broad top), with the neckline near the $496-$500 area (the July/Oct lows area and VWAP) now broken.
- The measured move from the double top is the peak-to-neckline distance (~$625 → ~$500 = ~$125), projecting toward about $375-$400. This is a long-range target, and a decline to the $440-$450 area is the nearest staging point.
- In the short term, the bounce from $447.73 to the $507 area looks like a Bearish Flag/Pennant (a small consolidation after a sharp drop), which would point to a continuation lower toward $450 and below.
- The bullish alternative is a Bullish Double Bottom in the $447-$450 area, but price would need to reclaim $520 and the EMA200/SMA200D cluster to confirm it.
POTENTIAL SCENARIOS
- Scenario 1: Bearish Continuation Lower — The break below the 200-day averages, -DI dominance, persistent distribution (CMF -0.127) and the bear flag after the Nov 5 flush point to a retest and break of the $447.73 low. Trigger: A daily close below $470, then below $447. Target: $420 (with the extended double top objective toward $395). Invalidation: A daily close above $525, reclaiming the EMA200/SMA200D. (50% probability)
- Scenario 2: Bullish Relief Rally / Double Bottom — The oversold washout of Nov 5 holds as a higher-low base, with RSI recovering above 50 and a MACD cross up. Price reclaims VWAP ($498) and the 200-day cluster. Trigger: A close above $525 with expanding volume. Target: $545-$560 (EMA50 and SMA50D). Invalidation: A close below $447. (30% probability)
- Scenario 3: Neutral Range Chop — Price oscillates between $447 and $525 as the oversold bounce fades but selling dries up. Trigger: Failed breaks on both sides, with ADX falling below 25. Target: $470-$500. Invalidation: A close outside $440-$530. (20% probability)
PRICE TARGETS
For 83 days (about 12 weeks) the guideline range width is 18-30% of price. The range chosen is $415.00 to $535.00, a width of $120 (24.7% of $486.75).
- Target Price: $465.00 (for 83 days, Feb 6, 2027)
- Expected Range: $415.00 to $535.00
- Key Levels: Support at $447.73, Resistance at $515.18
OVERALL BIAS
OVERALL BIAS: BEARISH - Price is below the EMA50, EMA200, SMA200D and VWAP, with -DI (36.7) far above +DI (17.6) at a strong ADX of 33.7, deep negative MACD and persistent CMF distribution (-0.127). Bearish structure (a broken double top, then a bear flag) points toward a retest of the $447.73 low, although the oversold bounce could produce relief rallies toward $515-$525.
This is educational analysis and not financial advice.