SMH 48-day bearish forecast — Nov 15, 2026
- Bias: Bearish
- Timeframe: 48 days (made Nov 15, 2026, target date Jan 1, 2027)
- Price at analysis: $486.75
- Price target: $462.00
- Expected range: $410.00 – $535.00
- Result: Pending — graded after the close on Jan 1, 2027
Get a free AI analysis of SMH today
Analysis
TECHNICAL INDICATORS
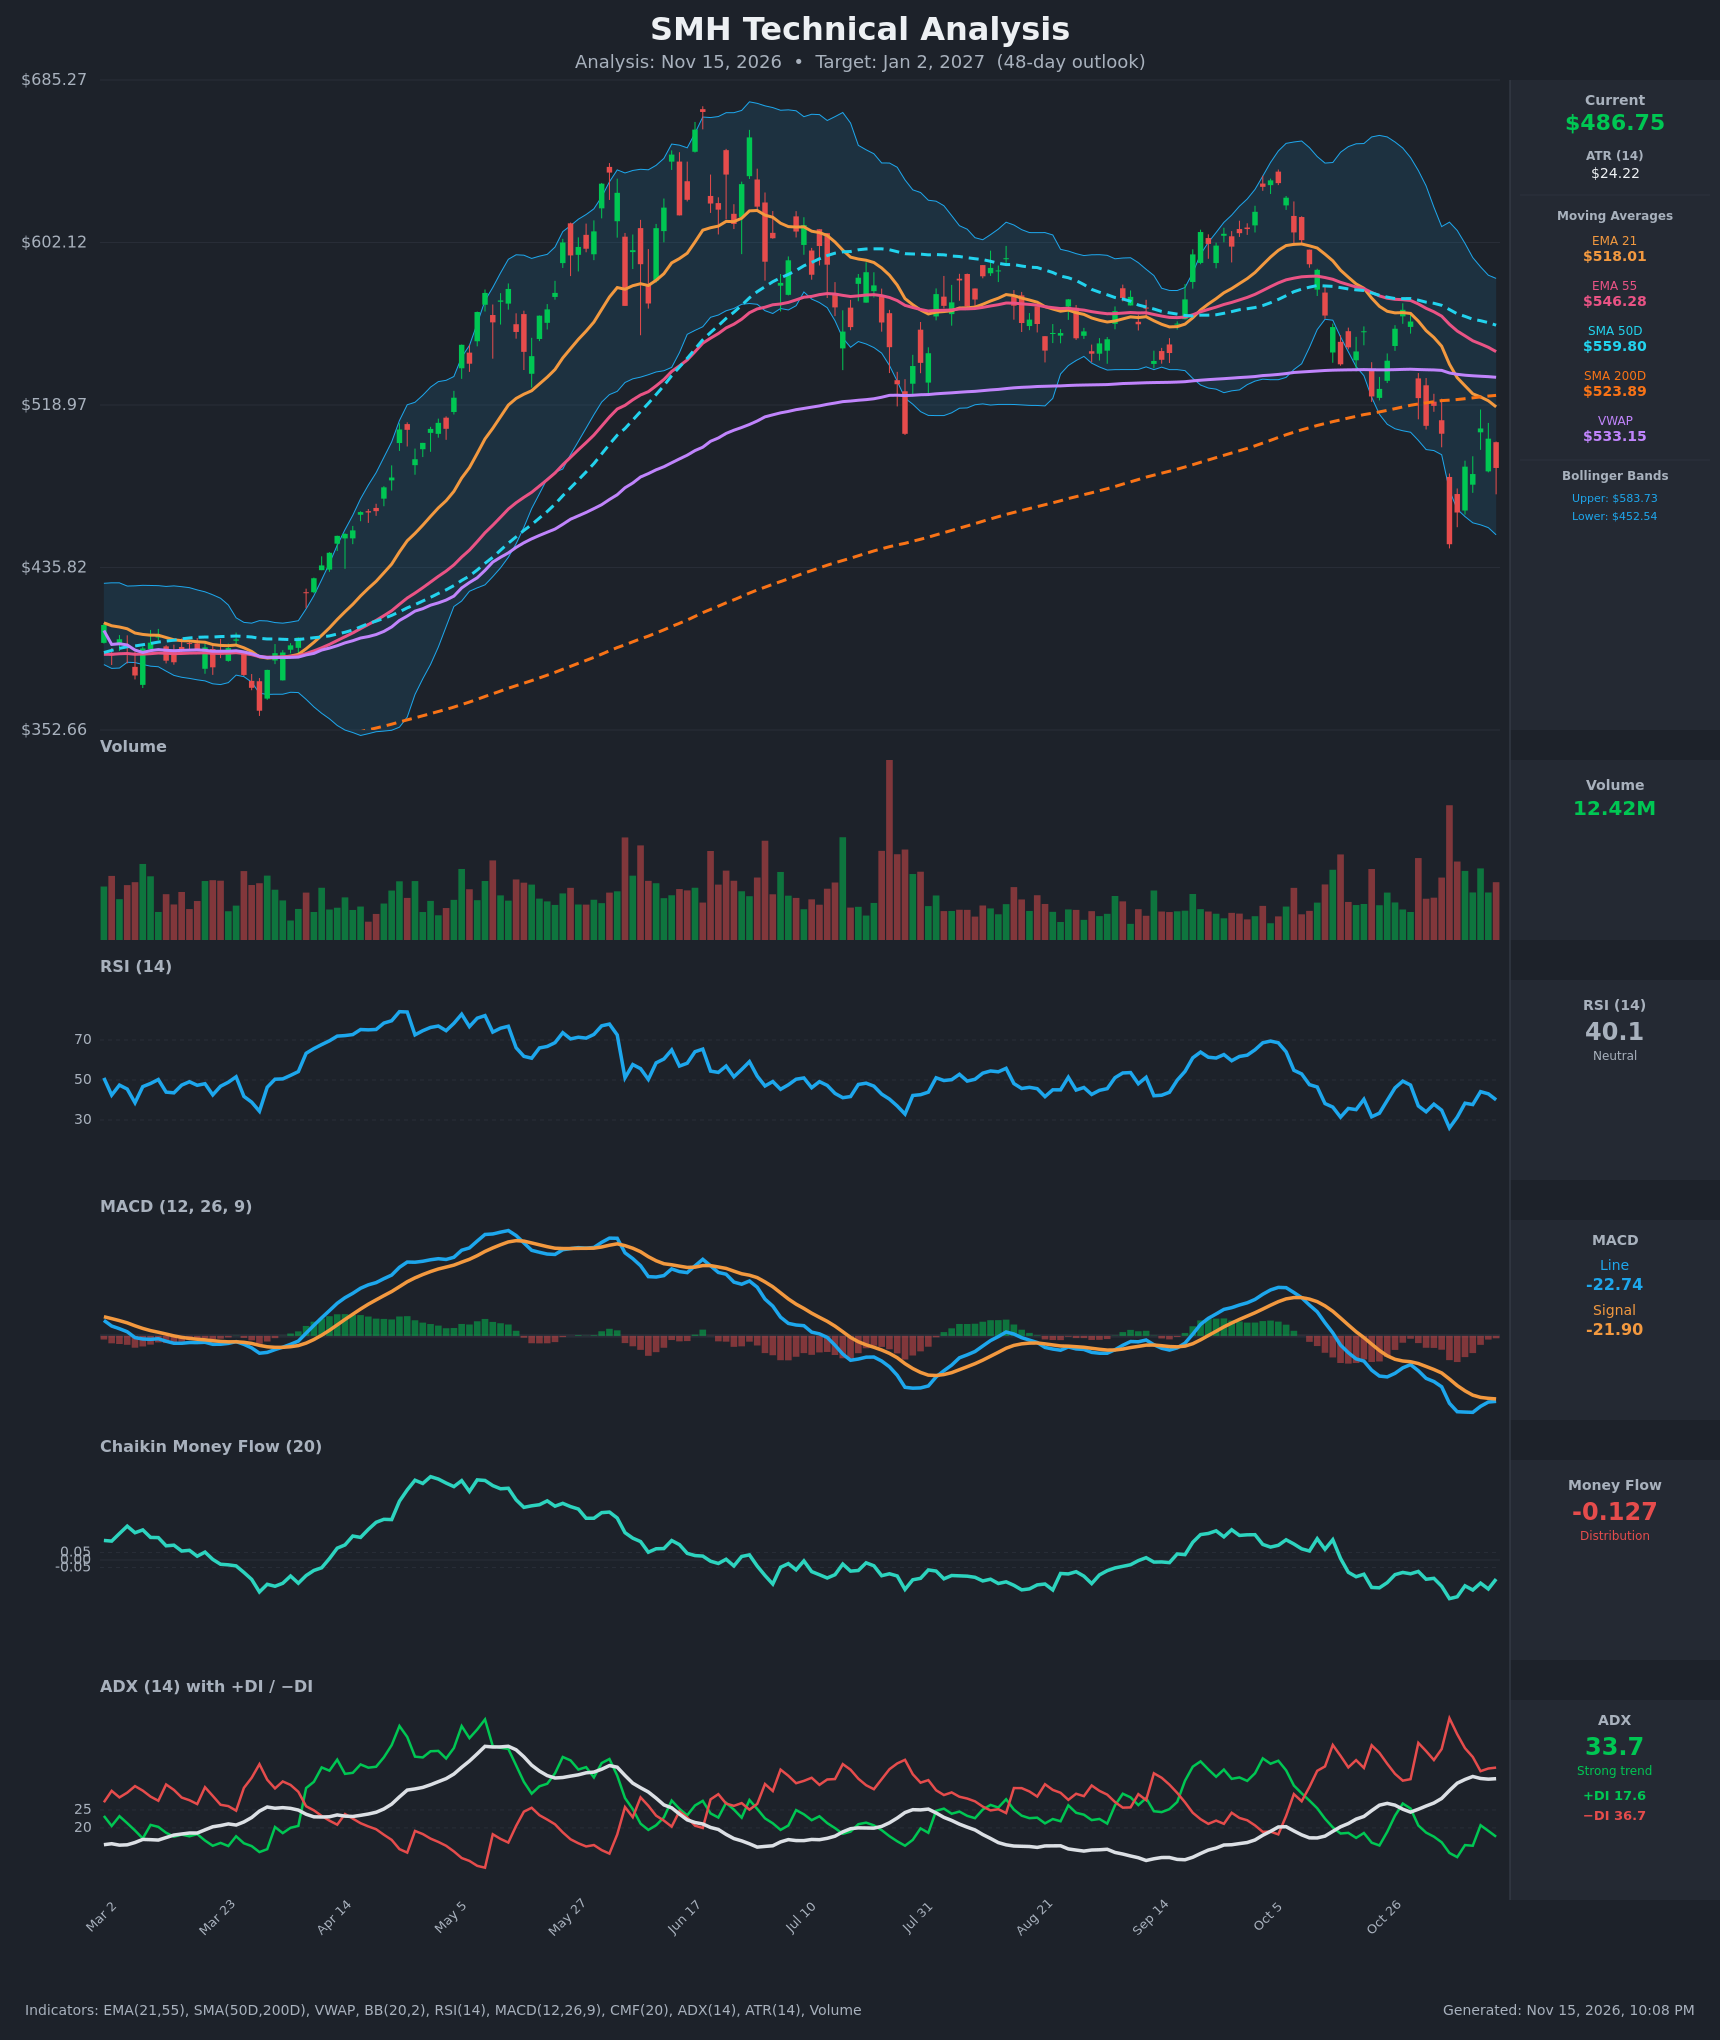
- RSI (14): 40.08, having bounced from oversold at 26.0 on Nov 5 but failing to reclaim 50. The recovery peaked at 44.2 and is rolling over again, so momentum is weak and still below neutral. [Bearish]
- 20 EMA (EMA 21): $518.01, with price at $486.75 (about 6% below it). The EMA is falling steeply, and price has closed below it for most of the last 10 bars, so it acts as overhead resistance. EMA 21 is also well below EMA 55 ($546.28). [Bearish]
- MACD: Line -22.74 vs signal -21.90, with a slightly negative histogram of about -0.84. The line is below zero and below the signal. It tried to turn up (-26.56 to -22.74), but the gap has narrowed to nearly a flat cross, so the bearish regime holds unless a decisive upside crossover follows. [Bearish]
- Bollinger Bands (20): Price sits in the lower half of the bands (lower $452.54, upper $583.73, midline about $518). The bands are wide after the Nov 5 flush to $447.73, which pierced the lower band. Price is recovering from the band extreme but is still well below the mid-band. [Bearish]
- CMF (20): -0.127, below -0.05 for a sustained stretch and as low as -0.258 on Nov 5. Selling pressure dominates and no accumulation is visible. [Distribution]
- ADX (14): 33.7 and rising, with −DI (36.7) far above +DI (17.6). That is a strong established downtrend with bears firmly in control. [Strong Trend – Bearish]
- Volume: 12.42M on the latest bar. Volume spiked on the Nov 5 breakdown (the large red bar), and the bounce volumes are not clearly stronger than the selling volumes. There is no convincing accumulation. [Bearish-leaning]
DIVERGENCES & TRENDS
- No bullish divergence: RSI made a higher low (26.0 → 31.4 on Nov 6, and 37.7 on Nov 10) while price made a similar low, but the failure to exceed 44 undercuts that. MACD and CMF are not confirming a reversal.
- Moving average structure: EMA 21 < EMA 55 < SMA 50D, all falling. Price is below all of them and below VWAP ($533.15). SMA 200D ($523.89) has also been lost, as price closed below it (it was a key support area). The SMA 50D remains above the SMA 200D (no death cross yet), but the gap is narrowing: $559.80 vs $523.89, down from about $58 to $36.
- MACD: The line is flattening toward the signal, so a short-term bounce is possible, but it is occurring below zero.
- ADX/DI: −DI has dominated since Oct 30. The DI spread (about 19 points) confirms trend persistence.
- Price structure: A lower high at roughly $567 (Oct 28) vs the prior peak near $600+, followed by a lower low at $447.73. Dow-style downtrend.
CHART PATTERNS
- Bearish Head and Shoulders / Double Top (broad): The June peak (~$650+) and the October rally peak (~$600) form a lower-high structure. The break of the ~$500–$520 neckline-style support (SMA 200D, Aug low) confirms a bearish reversal. The measured move points toward roughly $420–$440, from the prior peak and neckline distance.
- Bearish Flag/Pennant (short-term): The small bounce from $447.73 to about $507, then back down to $486.75, looks like a flag within the downtrend. A break below ~$480 would target the Nov 5 low ($447.73) and beyond.
- Support zone: The March–April base near $400–$435 is the major downside target if $447 fails.
POTENTIAL SCENARIOS
- Scenario 1: Bearish Trend Continuation — The strong downtrend (ADX 33.7, −DI dominance) resumes with a retest of the Nov 5 low and a break lower. Trigger: Close below $480, then below $447.73. Target: $430–$445. Invalidation: Daily close above $518 (EMA 21). (50% probability)
- Scenario 2: Neutral/Choppy Base — Price stabilizes at the lower Bollinger band area and ranges between $450 and $520 as the oversold bounce fades. Trigger: Holding $450 with RSI above 35. Target: $470–$510. Invalidation: Break below $447 or above $525. (25% probability)
- Scenario 3: Bullish Relief Recovery — The oversold bounce extends, with a bullish MACD cross and a reclaim of the SMA 200D. Trigger: Close above $518–$524 on rising volume. Target: $545–$560 (EMA 55 / SMA 50D zone). Invalidation: Fall back below $486. (25% probability)
PRICE TARGETS
- Target Price: $462.00 (48-day)
- Expected Range: $410.00 to $535.00 (width $125 ≈ 25.7% of current price, consistent with a 30–60 day horizon and ATR of about $24)
- Key Levels: Support at $447.73, Resistance at $518.01
OVERALL BIAS
OVERALL BIAS: BEARISH - Price is below all key moving averages, including the SMA 200D, with ADX at 33.7 and −DI dominance, negative CMF (-0.127), and a MACD still below zero and its signal line. The Nov 5 breakdown and weak bounce favor a retest of $447 and lower.
This is educational analysis and not financial advice.