SMH 34-day bearish forecast — Nov 15, 2026
- Bias: Bearish
- Timeframe: 34 days (made Nov 15, 2026, target date Dec 18, 2026)
- Price at analysis: $486.75
- Price target: $466.00
- Expected range: $430.00 – $505.00
- Result: Pending — graded after the close on Dec 18, 2026
Get a free AI analysis of SMH today
Analysis
TECHNICAL INDICATORS
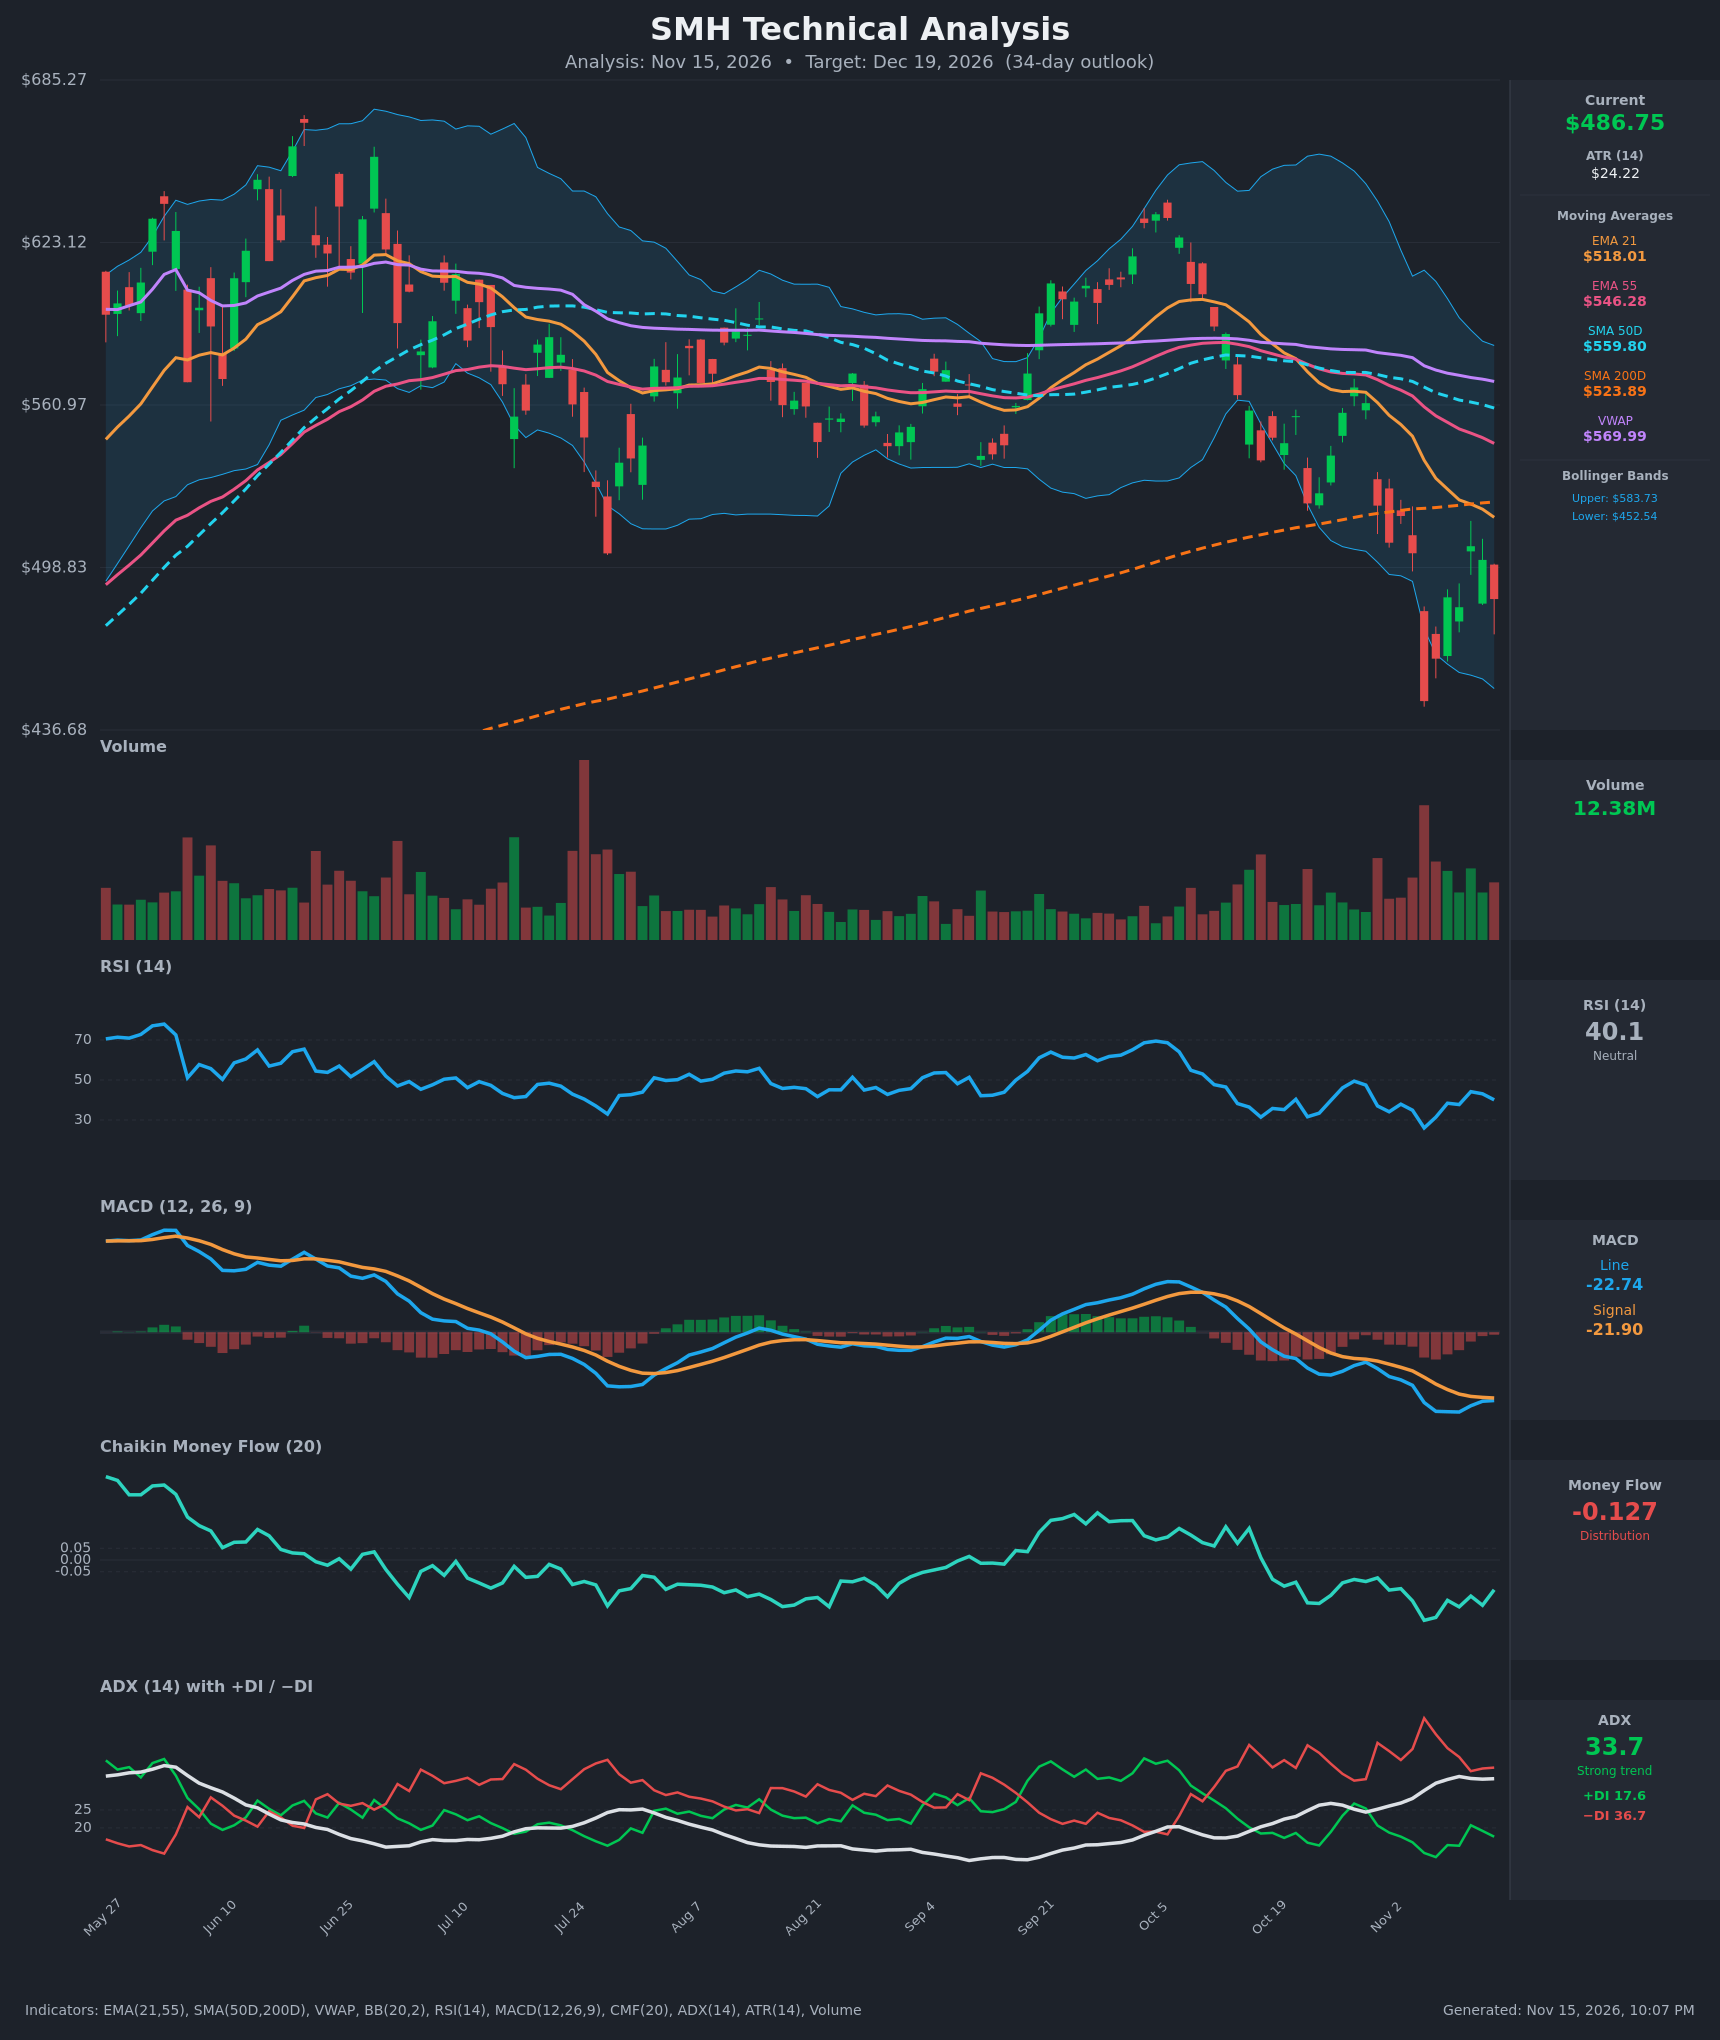
- RSI (14): 40.08, below the 50 midline and well off the Nov 5 low of 26.0. The bounce to 44 on Nov 11 failed, and RSI is now turning down again. It is not oversold, so there is room to fall further. [Bearish]
- 20 EMA: The supplied value is the 21 EMA at $518.01, with price at $486.75 (about 6% below). It is falling steeply (from $566.92 on Oct 26) and has acted as resistance on every bounce. The 21 EMA is also below the 55 EMA ($546.28), a bearish alignment. [Bearish]
- MACD: Line -22.74 is below signal -21.90, a histogram of about -0.84. The line has been below zero and below the signal for most of the last 15 bars. The histogram has narrowed from its Nov 10 low, so downside momentum is easing, but no bullish crossover has occurred. [Bearish]
- Bollinger Bands (20): Upper $583.73, lower $452.54, midline about $518. Price is in the lower third of the bands, after a Nov 5 tag and break of the lower band. The bands are wide, which shows elevated volatility, and the midline is still sloping down. [Bearish]
- CMF (20): -0.127, well below -0.05, and it has been negative for months with lower lows. This is persistent distribution, and it is not improving meaningfully on the bounce. [Distribution]
- ADX (14): 33.7 and rising, with −DI (36.7) far above +DI (17.6). That is a strong, established downtrend with sellers in control. There has been no bullish DI crossover. [Strong Trend – Bearish]
- Volume: 12.38M on the current bar, which is red. The Nov 5 capitulation bar was the heaviest of the recent run (a sharp -11% drop). Follow-through green bars on moderate volume show some dip buying, but volume is not strong enough to signal a reversal. [Bearish with signs of a relief bounce]
DIVERGENCES & TRENDS
- No bullish divergence yet. RSI (low of 26.0 on Nov 5, now 40) and MACD are confirming price weakness, not diverging. The RSI low is also lower than the July trough of about 32. CMF is making lower lows alongside price.
- Moving-average structure is bearish.
- EMA21 < EMA55 < SMA50D, and all are sloping down.
- Price is below VWAP ($569.99).
- Price has just lost the SMA200D ($523.89), which was the long-term support.
- SMA50D ($559.80) is still above SMA200D, so there is no death cross yet. It is converging, though, and a cross is possible within the 34-day window if weakness persists.
- MACD is at its lowest level in this chart window, with the line only marginally below the signal. A re-widening of the histogram would confirm further downside.
- ADX has risen from about 20 in early October to 33.7. −DI peaked at about 50 on Nov 5 and is fading, but it is still more than double +DI.
- Price action shows lower highs ($567.67 on Oct 28, then $518.52, then $506.96) and lower lows. The Nov 5 flush to $447.73 was followed by a weak, corrective bounce that has stalled below the declining EMA21.
CHART PATTERNS
- Bearish Double Top (macro): The peaks are about $665 in June and about $640 in October. The neckline is around the $500–$505 area (the July low), and price has now closed below it. The full measured move (about $160 of height) points far lower, to roughly $345, but that is beyond a 34-day horizon. It supports the bearish structure and the potential for continued downside.
- Bearish Pennant/Flag (short-term): The Nov 5 flush was followed by a small, choppy, lower-high bounce (Nov 9–12) that is compressing under the EMA21. A resolution lower would project a repeat of the Oct 30–Nov 5 drop (about $75–$90) toward the $400–$420 area, though this would likely play out over more than 34 days.
- Confirming evidence: The break below SMA200D and the failed rally at the EMA21 both reinforce continuation. A reclaim of $524 would invalidate the bearish pattern readings.
POTENTIAL SCENARIOS
- Scenario 1: Bearish Trend Continuation — The downtrend (ADX 33.7, −DI dominant, CMF in distribution) resumes after a failed bounce under the falling EMA21 and SMA200D. Price retests the Nov 5 low and may undercut it. Trigger: a daily close below $480, then a break of $447.73. Target: $450–$465, with an extension to about $425 on a breakdown. Invalidation: a daily close above $524 (SMA200D reclaimed) with MACD crossing up. (52% probability)
- Scenario 2: Bullish Relief Rally / Mean Reversion — The oversold bounce from the Nov 5 capitulation extends as RSI turns up from the 40 area and price recovers toward the declining averages. Trigger: a close above $507, then $518 (EMA21). Target: $518–$524, with a stretch to about $546 (EMA55). Invalidation: a failure at the EMA21 and a close below $447.73. (30% probability)
- Scenario 3: Neutral Choppy Base — Price consolidates between the Nov 5 low and the EMA21 while ADX cools. Trigger: price oscillating in the $450–$515 range. Target: about $485. Invalidation: a decisive close outside $447–$524. (18% probability)
PRICE TARGETS
- Target Price: $466.00 (34-day horizon, Dec 19, 2026)
- Expected Range: $430.00 to $505.00 (width $75, about 15.4% of current price, consistent with the 30–60 day guidance of 12–18%)
- Key Levels: Support at $447.73 (Nov 5 low), Resistance at $518.01 (EMA21, with SMA200D just above at $523.89)
OVERALL BIAS
OVERALL BIAS: BEARISH - ADX is at 33.7 with −DI more than double +DI, price is below every EMA/SMA and has lost the SMA200D, and CMF shows persistent distribution. MACD is below its signal. The bounce has been corrective and is stalling beneath the falling EMA21, so a retest of the $448 low is more likely than a reclaim of $524.
This is educational analysis and not financial advice.