SMH 27-day bearish forecast — Nov 15, 2026
- Bias: Bearish
- Timeframe: 27 days (made Nov 15, 2026, target date Dec 11, 2026)
- Price at analysis: $486.75
- Price target: $470.00
- Expected range: $440.00 – $520.00
- Result: Pending — graded after the close on Dec 11, 2026
Get a free AI analysis of SMH today
Analysis
TECHNICAL INDICATORS
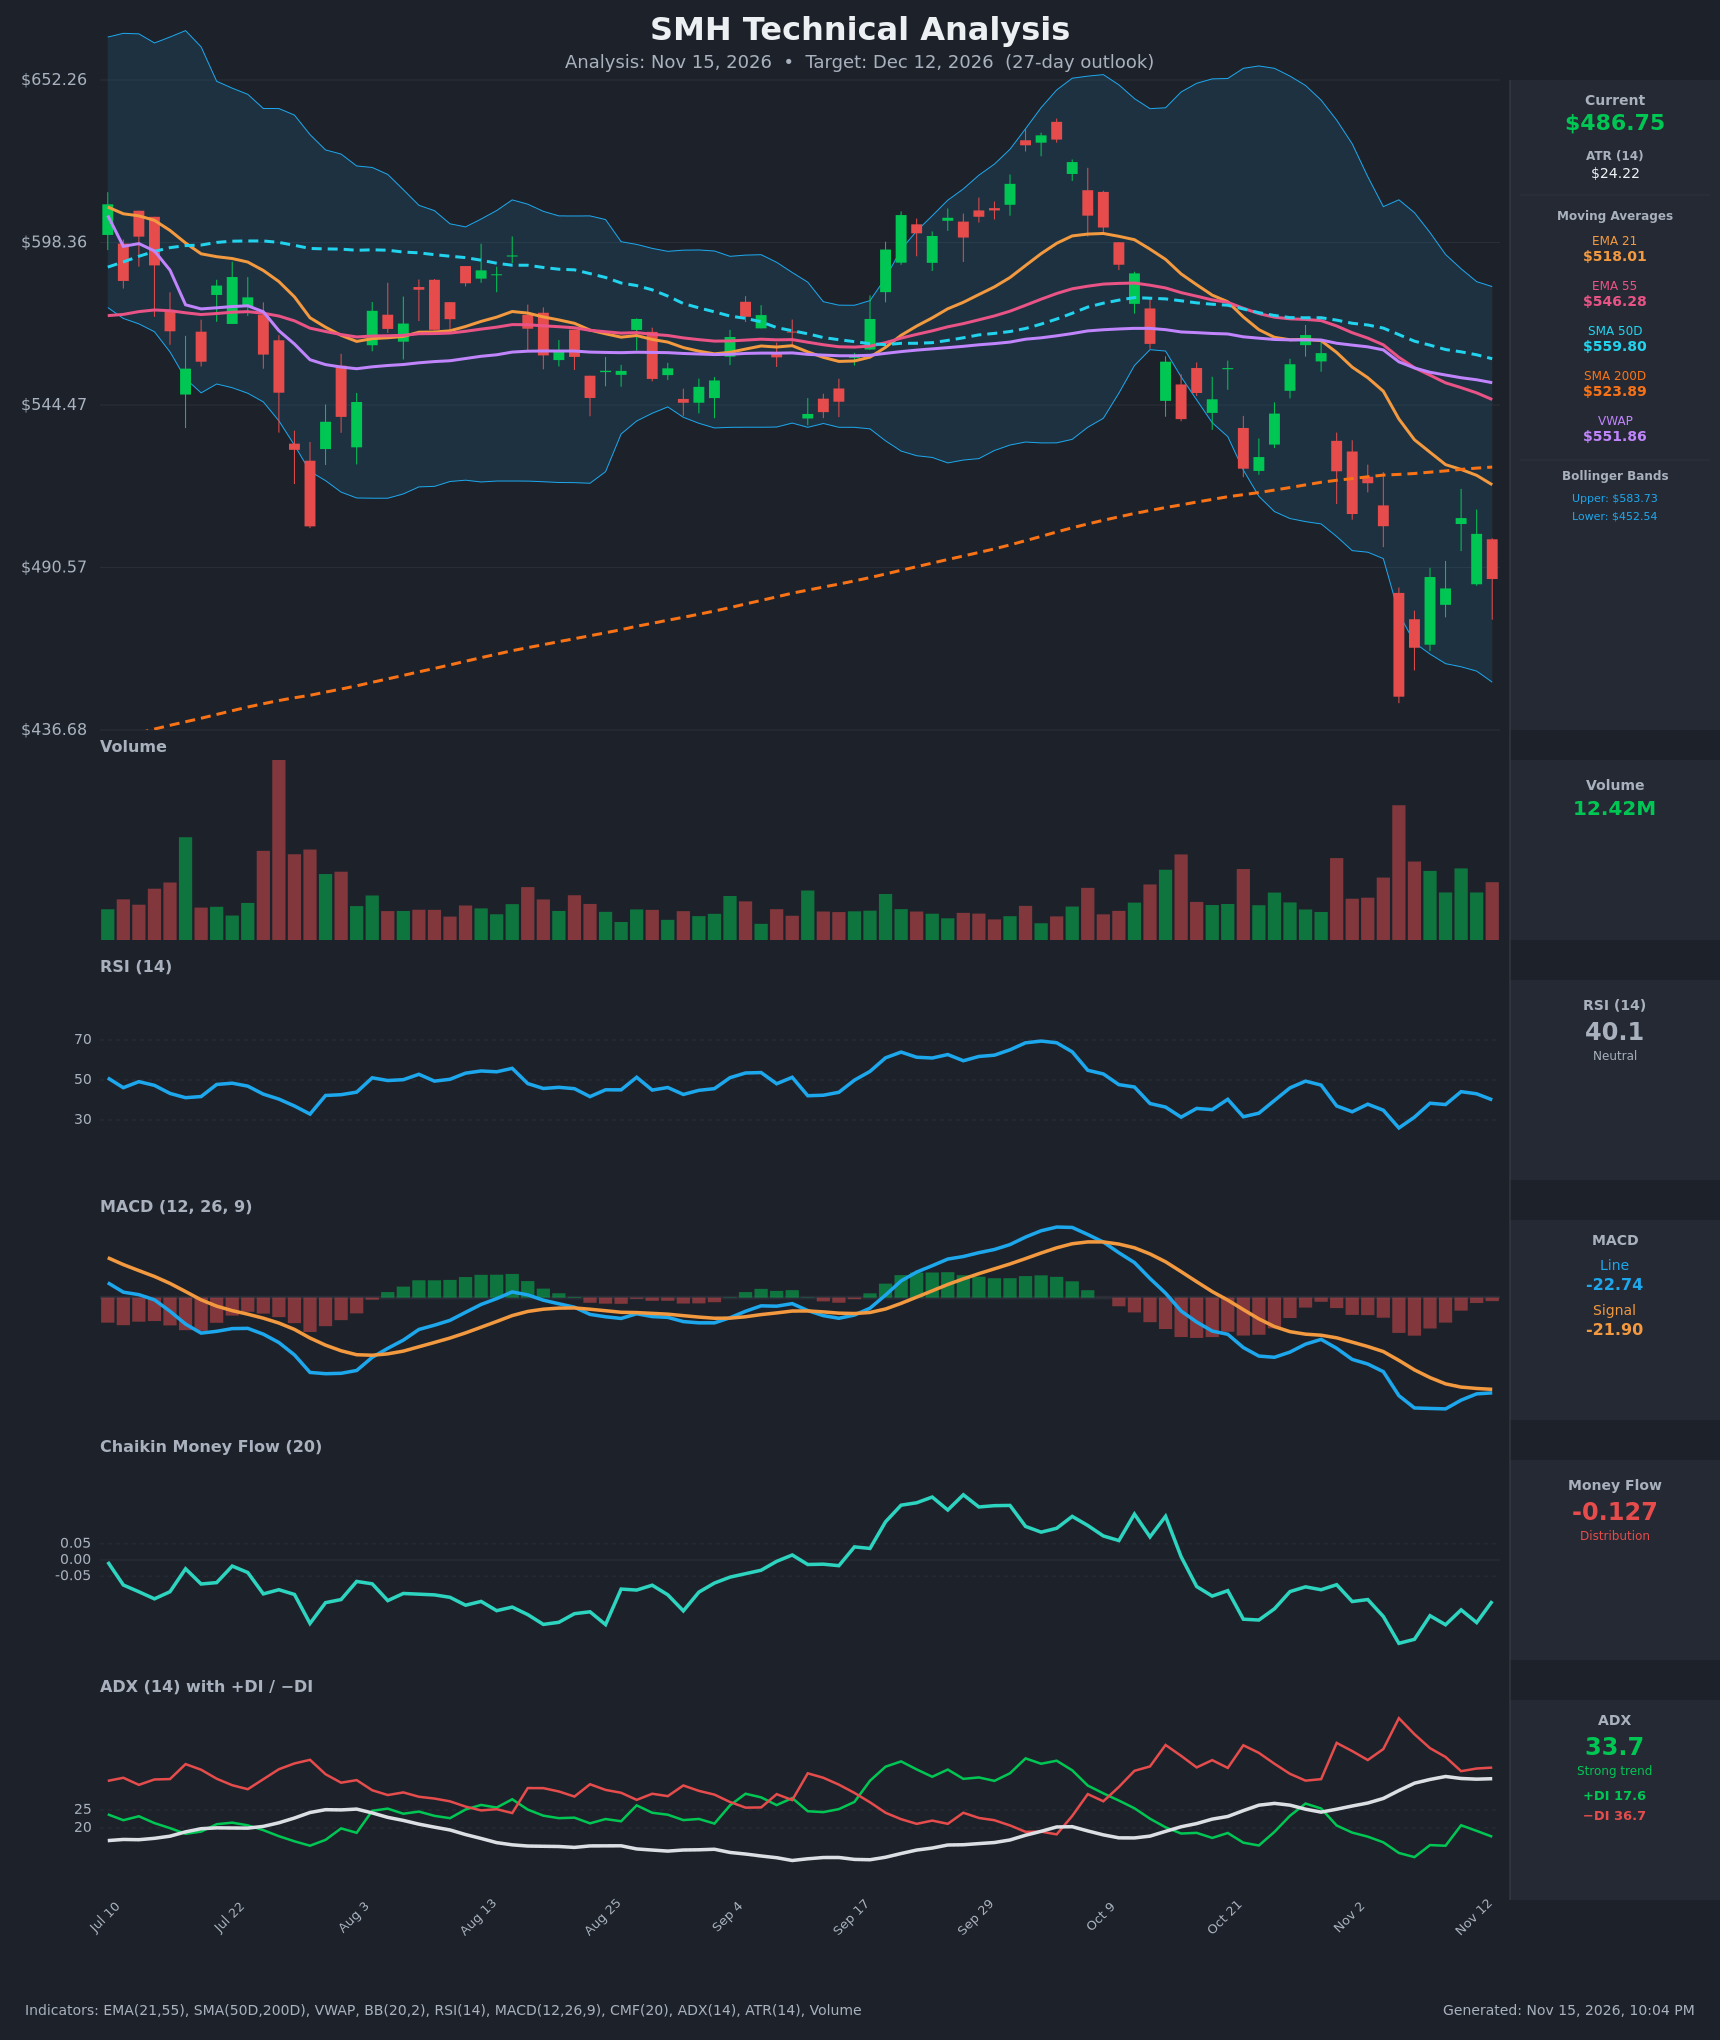
- RSI (14): 40.08, below the 50 midline but not oversold. It bottomed at 26.0 on Nov 5 and bounced to 44.2 on Nov 11, then rolled over to 40.1. The oversold bounce looks to be fading. [Bearish]
- 20 EMA (EMA 21): $518.01, with price at $486.75, about 6% below. The EMA is falling steeply and is also below EMA 55 ($546.28), a bearish alignment. It is the first overhead resistance. [Bearish]
- MACD: Line -22.74 is below signal -21.90, a histogram of about -0.84. Both lines are deeply negative. The histogram is shrinking, so downside momentum is easing, but there is no bullish crossover yet. [Bearish]
- Bollinger Bands (20): Upper $583.73, lower $452.54, midline about $518. Price is in the lower third of the bands, below the midline. The Nov 5 low of $447.73 pierced the lower band, and bands are still wide after the sell-off. A band-walk to the downside is possible, but a bounce toward the midline is also in play. [Bearish]
- CMF (20): -0.127, below -0.05 and negative throughout the decline. It has only partly recovered from its low, so selling pressure persists. [Distribution]
- ADX (14): 33.7 and rising, with −DI (36.7) far above +DI (17.6). That is a strong, established downtrend with the bears firmly in control. [Strong Trend – Bearish]
- Volume: 12.42M. The heaviest volume of the period came on the Nov 5 capitulation drop, and the bounce volume has been average. Selling is heavier than buying, with no sign of a volume-backed reversal. [Bearish/Neutral]
DIVERGENCES & TRENDS
- Price made a lower low on Nov 5 ($447.73), and RSI made its low at 26.0 at the same time. There is no clear bullish divergence yet. The current RSI (40) is above its Nov 5 low while price is well above the low too, so nothing diverges meaningfully.
- Price is below the EMA 21, EMA 55, SMA 50D, SMA 200D and VWAP. Losing the SMA 200D ($523.89), which had been rising support, is a major technical break.
- EMA 21 crossed below EMA 55 before the data window began and the gap is widening. SMA 50D ($559.80) is converging on SMA 200D ($523.89). A death cross is not yet confirmed, but the gap is narrowing about $1.5 to $2 per day.
- MACD is flattening against its signal, so there is a possible bullish crossover in the next few sessions. It would be a weak relief signal inside a downtrend, since both lines are far below zero.
- The −DI above +DI and the ADX rising above 33 confirm a strong downtrend.
- The last candle is red with a long lower wick. It shows some dip buying but closed near the lows of the day.
CHART PATTERNS
- Broad Bearish Head and Shoulders / Triple-Top-style distribution (loose fit): The September to early-October peak (~$640) was the head. The break below the ~$545 to $550 area (VWAP/EMA 55 zone) has produced a measured move toward the mid-$400s. This is an approximate fit rather than a textbook one.
- Bearish Flag / Pennant (tentative): The rebound from $447.73 to about $507 has formed a short consolidation within a steep downtrend. A break below the ~$484 to $487 area would project a further drop of roughly $50 to $60, toward $430 to $440.
- Bullish Double Bottom (unconfirmed counter-pattern): The $448 low and the $484 retest do not form an equal-low double bottom. A confirmed breakout would need a close above about $507, then $524, and so is not triggered.
- The pattern signals lean bearish, with the first bullish confirmation only on a reclaim of the $507 to $524 zone.
POTENTIAL SCENARIOS
- Scenario 1: Bearish Trend Continuation — Sellers stay in control (ADX above 30, −DI dominant). Price fails at the $507 to $518 area (the EMA 21), breaks the $484 to $487 range floor and retests the $448 low. Trigger: daily close below $484 on volume above 12M. Target: $450 to $465, with an extension to $440 if $448 breaks. Invalidation: daily close above $524 (SMA 200D). (50% probability)
- Scenario 2: Bullish Relief Rally — Oversold conditions, a MACD bullish crossover and the lower Bollinger band bounce lead to mean reversion toward the middle band and the moving-average cluster. Trigger: close above $507 with CMF turning above 0. Target: $518 to $524, extending to $545 if the SMA 200D is reclaimed. Invalidation: close below $470, then a break of $448. (35% probability)
- Scenario 3: Neutral Range Consolidation — Price chops between $448 and $510 as ADX peaks and fades. Trigger: ADX rolls over below 30 with price staying inside the range. Target: $470 to $500. Invalidation: close outside $445 to $515. (15% probability)
PRICE TARGETS
- Target Price: $470.00 (27-day horizon, about -3.4%)
- Expected Range: $440.00 to $520.00 (width $80, about 16.4%, in line with the 12-18% guidance for 30 to 60 days, slightly narrower for 27 days)
- Key Levels: Support at $447.73 (Nov 5 low), Resistance at $506.96 (recent swing high), with further resistance at $518.01 (EMA 21) and $523.89 (SMA 200D)
OVERALL BIAS
OVERALL BIAS: BEARISH - Price is below every major moving average and VWAP, and ADX is at 33.7 with −DI (36.7) far above +DI (17.6). CMF is in distribution at -0.127 and MACD is below its signal line. A relief bounce toward $518 to $524 is plausible, but the weight of the evidence favors continuation lower or a retest of the $448 area.
This is educational analysis and not financial advice.