SMH 20-day bearish forecast — Nov 15, 2026
- Bias: Bearish
- Timeframe: 20 days (made Nov 15, 2026, target date Dec 4, 2026)
- Price at analysis: $486.75
- Price target: $472.00
- Expected range: $448.00 – $502.00
- Result: Pending — graded after the close on Dec 4, 2026
Get a free AI analysis of SMH today
Analysis
TECHNICAL INDICATORS
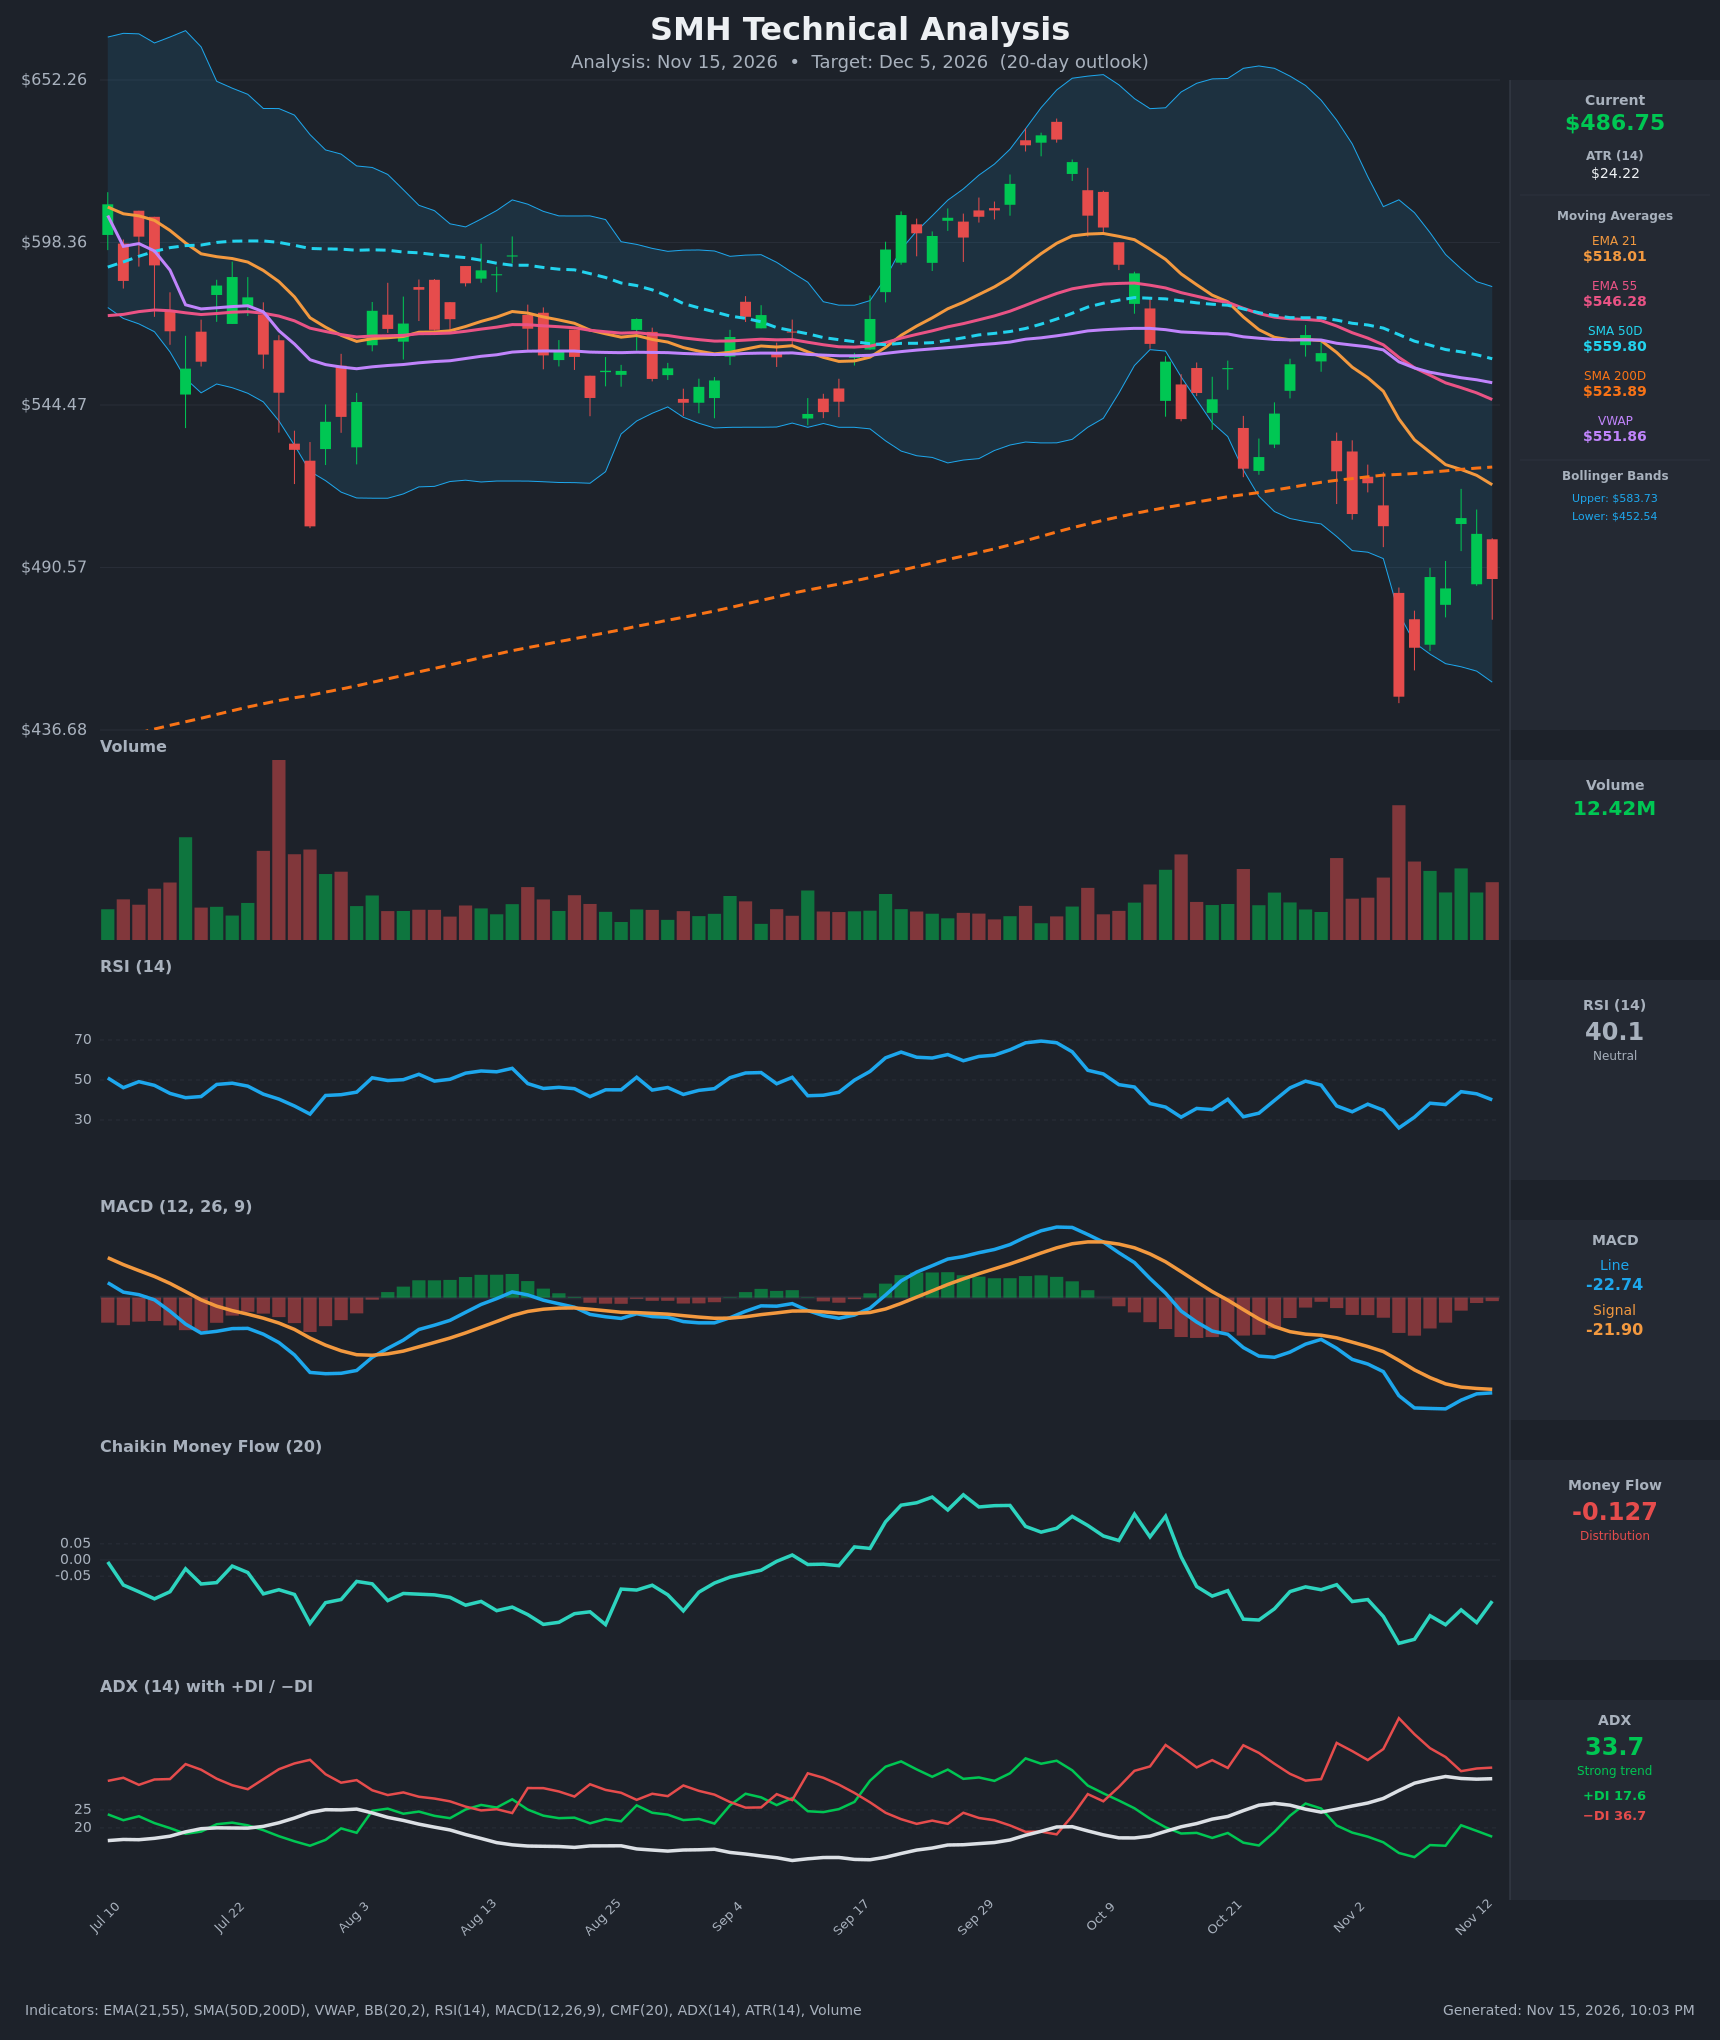
- RSI (14): 40.08, below 50 but above the 30 oversold line. It bottomed at 26.0 on Nov 5 and bounced to 44 before rolling over again. Momentum is weak with a pattern of lower highs (49 → 44), so the bounce has not repaired the downtrend. [Bearish]
- 20 EMA: The chart and data use the EMA 21 at $518.01. Price at $486.75 is about 6% below it, and the EMA is sloping down steeply. EMA21 is also below EMA55 ($546.28), a bearish alignment. Price failed to reclaim it on the Nov 11 bounce, so it is overhead resistance. [Bearish]
- MACD: Line -22.74 is below signal -21.90, giving a small negative histogram of about -0.84. The histogram has narrowed sharply from the Nov 5-10 lows, so downside momentum is decelerating. Both lines are deeply negative and there is no bullish crossover yet. [Bearish]
- Bollinger Bands (20): Price is in the lower half of the bands (lower $452.54, upper $583.73, mid about $518). The bands are wide and expanding after the selloff. Price walked the lower band on Nov 5 and bounced, but it has not reclaimed the midline. This is a volatile downtrend with a modest mean-reversion pull. [Bearish]
- CMF (20): -0.127, well below the -0.05 threshold. It has been negative for most of the past two months, hitting -0.258 on Nov 5. Sellers still dominate volume flow, and the small uptick has not turned it positive. [Distribution]
- ADX (14): 33.7 and rising, with −DI (36.7) far above +DI (17.6). That is a strong, established downtrend, and the bears remain in control. +DI has not crossed back above −DI. [Strong Trend - Bearish]
- Volume: 12.42M on the latest bar, which is about average. The largest volume spike came on the Nov 5 breakdown, with only moderate volume on the rebound. The weak rebound volume suggests the bounce is corrective rather than a true reversal. [Bearish-leaning]
DIVERGENCES & TRENDS
- Price vs. RSI: RSI made its low of 26.0 on Nov 5 while price made its low at $447.73. The subsequent price low was $483.63 on Nov 10, with RSI at 37.7. This is a mild bullish stabilization, not a confirmed divergence.
- MACD histogram: It is narrowing toward zero, but the line is still below the signal line. A bullish crossover is possible in the next few sessions, so this is the main counter-signal.
- Moving averages: Price is below EMA21, EMA55, SMA50D ($559.80) and VWAP ($551.86). It is also now below SMA200D ($523.89), which is a significant loss of long-term support. SMA50D is converging on SMA200D (about $36 apart and narrowing), so a death cross is a real risk over the coming weeks.
- Trend structure: Lower highs ($567.67 → $518.52 → $506.96) and lower lows confirm a downtrend. The ADX has risen from about 24 to 34, so the trend is strengthening.
- DI lines: −DI is dominant, and the Nov 5 spike to 50.4 was only partly retraced.
CHART PATTERNS
- Bearish Flag / Descending structure: After the sharp drop on Nov 5, the rebound to roughly $507 and the rollover resemble a bearish flag or pennant. A breakdown below the $483 swing low would project toward the $447.73 low, and a measured move could reach the mid-$420s.
- Failed support: The break below SMA200D after a long uptrend is a classic trend-change signal. A reclaim of $524 would invalidate it.
- Bullish alternative: The long lower wicks near $447-$483 hint at a possible bullish Double Bottom or falling wedge. It is unconfirmed because the neckline near $507-$518 has not been broken.
- Pattern bias: Bearish continuation is favored given ADX, DI and CMF.
POTENTIAL SCENARIOS
- Scenario 1: Bearish Trend Continuation — The flag-like rebound fails below the EMA21 and sellers push back toward the prior capitulation low. Trigger: close below $483.63 with CMF staying negative. Target: $450-$460, with an overshoot toward $440 possible. Invalidation: daily close above $518 (EMA21). (50% probability)
- Scenario 2: Bullish Relief Bounce / Double Bottom — The oversold bounce extends as the MACD histogram turns positive and price reclaims the EMA21, with a pause near SMA200D. Trigger: close above $507 followed by a push above $518. Target: $518-$525, with an extension to $546 (EMA55) if momentum builds. Invalidation: close below $470. (32% probability)
- Scenario 3: Neutral Choppy Consolidation — Price ranges between the $447.73 low and the $507 high as volatility cools. Trigger: ADX rolls over and price holds the $470-$505 zone. Target: $480-$495. Invalidation: close outside $447-$520. (18% probability)
PRICE TARGETS
- Target Price: $472.00 (20 days, Dec 5, 2026)
- Expected Range: $448.00 to $502.00 (width $54, about 11.1% of current price, in line with the 14-21 day guidance)
- Key Levels: Support at $447.73, Resistance at $506.96
OVERALL BIAS
OVERALL BIAS: BEARISH - The strong ADX of 33.7 with −DI far above +DI, negative CMF of -0.127, and price below all key moving averages including the SMA200D support the downtrend. The weak, lower-high rebound also points lower. The narrowing MACD histogram suggests the downside may be slowing, so conviction is moderate.
This is educational analysis and not financial advice.