SMH 7-day bearish forecast — Oct 31, 2026
- Bias: Bearish
- Timeframe: 7 days (made Oct 31, 2026, target date Nov 6, 2026)
- Price at analysis: $522.83
- Price target: $514.00
- Expected range: $496.00 – $535.00
- Result: Correct (-10.9%) — closed at $465.99 on Nov 6, 2026; quality score 50/100
Get a free AI analysis of SMH today
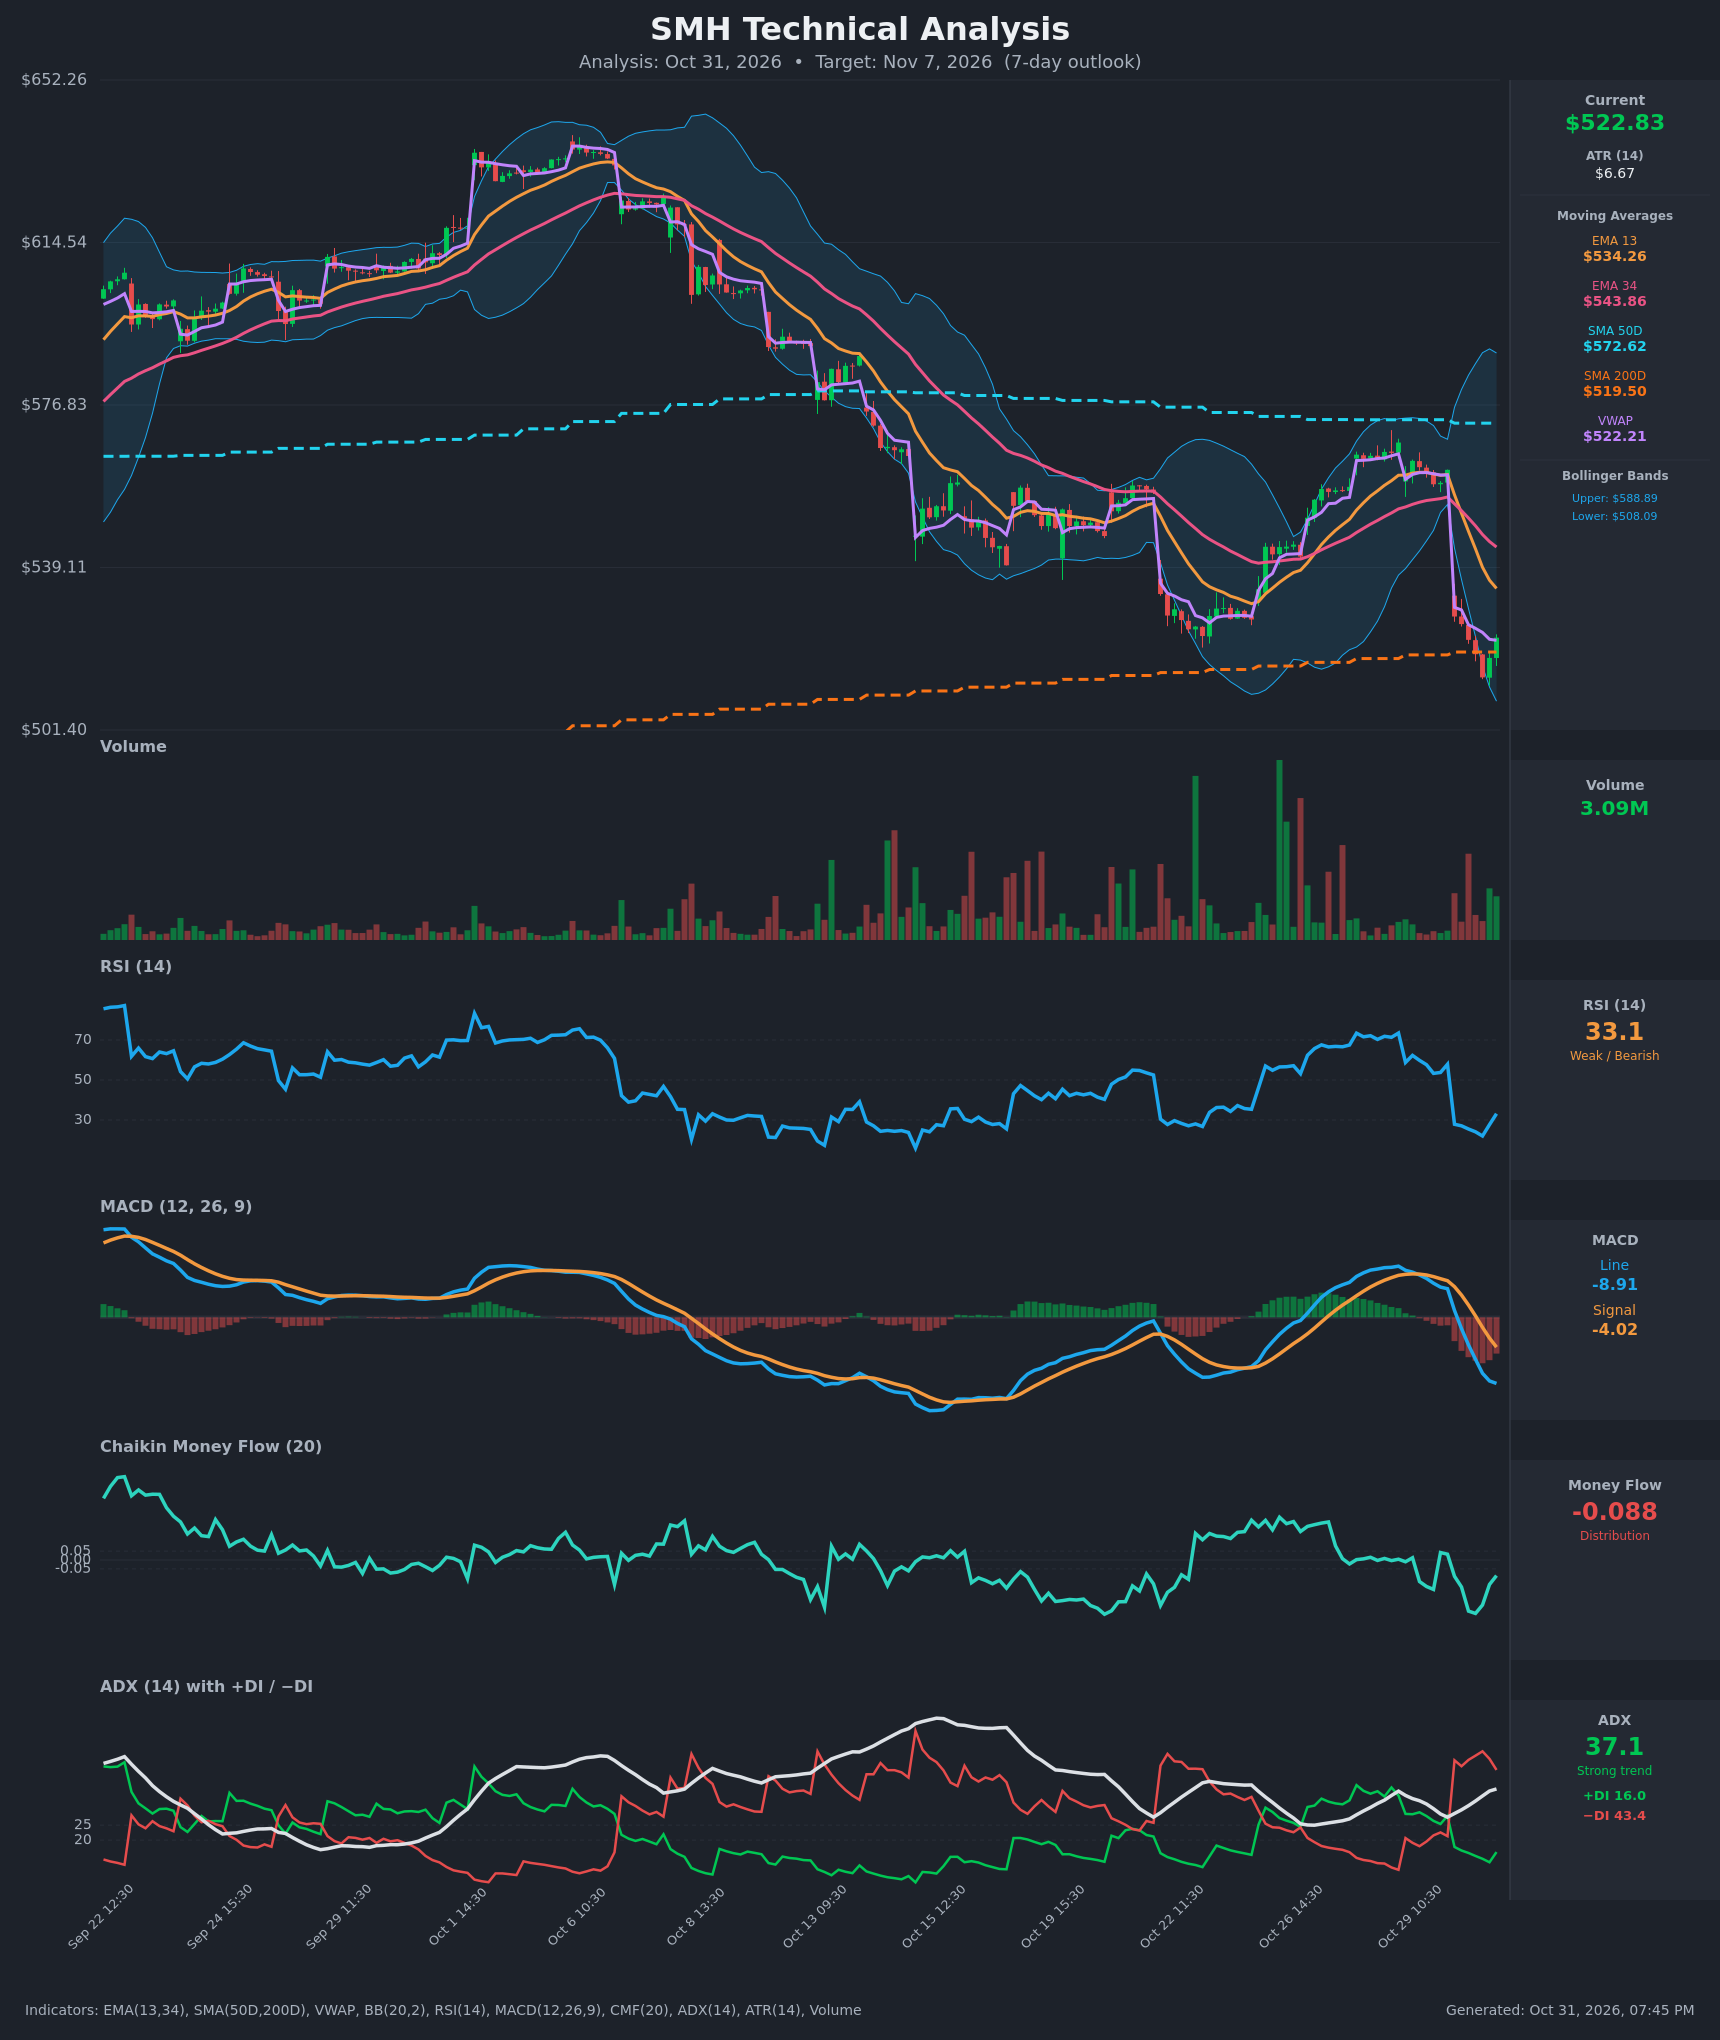
Analysis
TECHNICAL INDICATORS
- RSI (14): 33.15, bouncing off a 22.0 low on Oct 30 but still below 40 and under the 50 midline. Momentum is weak, and the bounce has not yet shown a trend reversal. [Bearish]
- 20 EMA: The data gives EMA 13 at $534.26 and EMA 34 at $543.86. Price at $522.83 is below both, and EMA13 is below EMA34 after a sharp bearish cross on Oct 30. Both now act as overhead resistance, with EMA13 the first hurdle about 2.2% higher. [Bearish]
- MACD: The line is -8.91 and the signal is -4.02, so the line is below the signal and below zero. The bearish crossover happened Oct 30 (about 11:30–12:30) and the histogram is widening to the downside. Momentum is still deteriorating, with no sign of a turn. [Bearish]
- Bollinger Bands (20): The bands run $508.09 to $588.89 and are wide after the gap. Price is in the lower quarter of the bands, having touched or pierced the lower band at the $513.61 low before bouncing. The wide bands mean volatility is elevated. A bounce toward the midline (~$548) is possible, but riding the lower band is typical of a strong downtrend. [Bearish]
- CMF (20): -0.088, below the -0.05 threshold, though it improved from -0.301 at the low. This is still distribution, with only tentative improvement. [Distribution]
- ADX (14): 37.1 and rising, with −DI (43.4) far above +DI (16.0). This is a strong, bearish-controlled trend. The DI spread narrowed slightly in the last bar as the bounce began. [Strong Trend – Bearish]
- Volume: 3.09M on the latest bar. Volume spiked on the Oct 30 gap-down sell-off and the red bars are heavier than the green ones. The bounce on recent bars is on modest volume, which suggests weak buyer conviction. [Bearish – selling pressure with a low-conviction bounce]
Other context from the data:
- VWAP and SMA200D: VWAP is $522.21, so price is just above it and roughly flat to it, which is neutral. Price is also hovering right at the SMA200D ($519.50), so this is a critical decision point.
- SMA50D: At $572.62 it is far overhead and above the SMA200D. There is no death cross, but price has lost the 50-day decisively.
DIVERGENCES & TRENDS
- Divergences: There is no clear bullish divergence yet. RSI made a very low reading (22.0) at the $513.61 price low, and the latest bounce has not produced a higher-low structure on price. RSI is recovering faster than price, which only hints at short-term oversold relief.
- Trend: The prior structure was a rally from ~$535 (Oct 22) to ~$568 (Oct 28), followed by an overnight/opening gap from $561.78 to $527.73 (-6%). That gap broke the EMA13/34 cluster and the Oct 22 swing low in one move.
- Crossovers and breaks:
- EMA13 crossed below EMA34 on Oct 30.
- MACD crossed bearishly on Oct 30.
- −DI overtook +DI sharply.
- Price is now testing the SMA200D at $519.50 from above.
- Gap and resistance: The gap zone ($528–$562) is overhead supply. Dead-cat bounces into the $534 (EMA13) to $544 (EMA34) area are likely to be sold.
CHART PATTERNS
- Bearish Double Top (primary): There are two highs around $568–$572 (the mid-October high and the Oct 28 high), with a neckline near $535–$540 (the Oct 22 trough). The Oct 30 gap broke below that neckline. The measured move is roughly $570 − $537 = ~$33, which projects to about $503–$505. This is a larger-than-7-day target, but it shows the downside bias.
- Possible neckline retest: A retest of the broken neckline/EMA13 zone ($534–$540) is a typical pullback before continuation. A bearish flag or pennant could form from here.
- Bullish counter-case: Price is sitting on the SMA200D with RSI bouncing from deeply oversold. A Bullish Double Bottom is possible if $513.61 holds on a retest, but it is not confirmed.
POTENTIAL SCENARIOS
- Scenario 1: Bearish Dead-Cat Bounce Then Continuation — Price bounces into the EMA13/gap resistance ($530–$535), fails, and rolls over, losing the SMA200D with −DI still dominant. Trigger: rejection at $534 or a close below $519.50 / $513.61. Target: $505–$514, with an extension toward the lower band at ~$508 and below. Invalidation: a close above $544 (EMA34). (50% probability)
- Scenario 2: Bullish Oversold Relief Rally — The SMA200D holds, RSI climbs back above 40 and price fills part of the gap. Trigger: a break above $534.26 with improving volume and CMF turning positive. Target: $540–$548 (the EMA34 and BB midline area). Invalidation: a drop below $513.61. (35% probability)
- Scenario 3: Neutral Consolidation at the 200-Day — Price chops between $510 and $535 as sellers and dip-buyers balance. Trigger: low volume and a narrowing DI spread. Target: about $520–$526. Invalidation: a decisive close outside $508–$535. (15% probability)
PRICE TARGETS
- Target Price: $514.00 (7-day)
- Expected Range: $496.00 to $535.00 (width $39 ≈ 7.5% of the current price, consistent with the 7–10 day guidance; ATR of $6.67 gives about $17 of one-sigma movement over 7 days, and the wide Bollinger Bands support the wide range)
- Key Levels: Support at $508.09 (lower Bollinger Band, just below the $513.61 recent low), Resistance at $534.26 (EMA13 / gap-fill zone)
OVERALL BIAS
OVERALL BIAS: BEARISH - A strong downtrend (ADX 37 with −DI 43 vs +DI 16), a bearish MACD cross, price below all key EMAs and breaking a double-top neckline, and CMF in distribution outweigh the oversold RSI bounce. The SMA200D/lower band area may give a short bounce, but the path of least resistance over 7 days is lower.
This is educational analysis and not financial advice.