DELL 4-day bullish forecast — Oct 31, 2026
- Bias: Bullish
- Timeframe: 4 days (made Oct 31, 2026, target date Nov 3, 2026)
- Price at analysis: $423.93
- Price target: $428.50
- Expected range: $415.00 – $435.00
- Result: Incorrect (-3.3%) — closed at $410.00 on Nov 3, 2026; quality score 21/100
Get a free AI analysis of DELL today
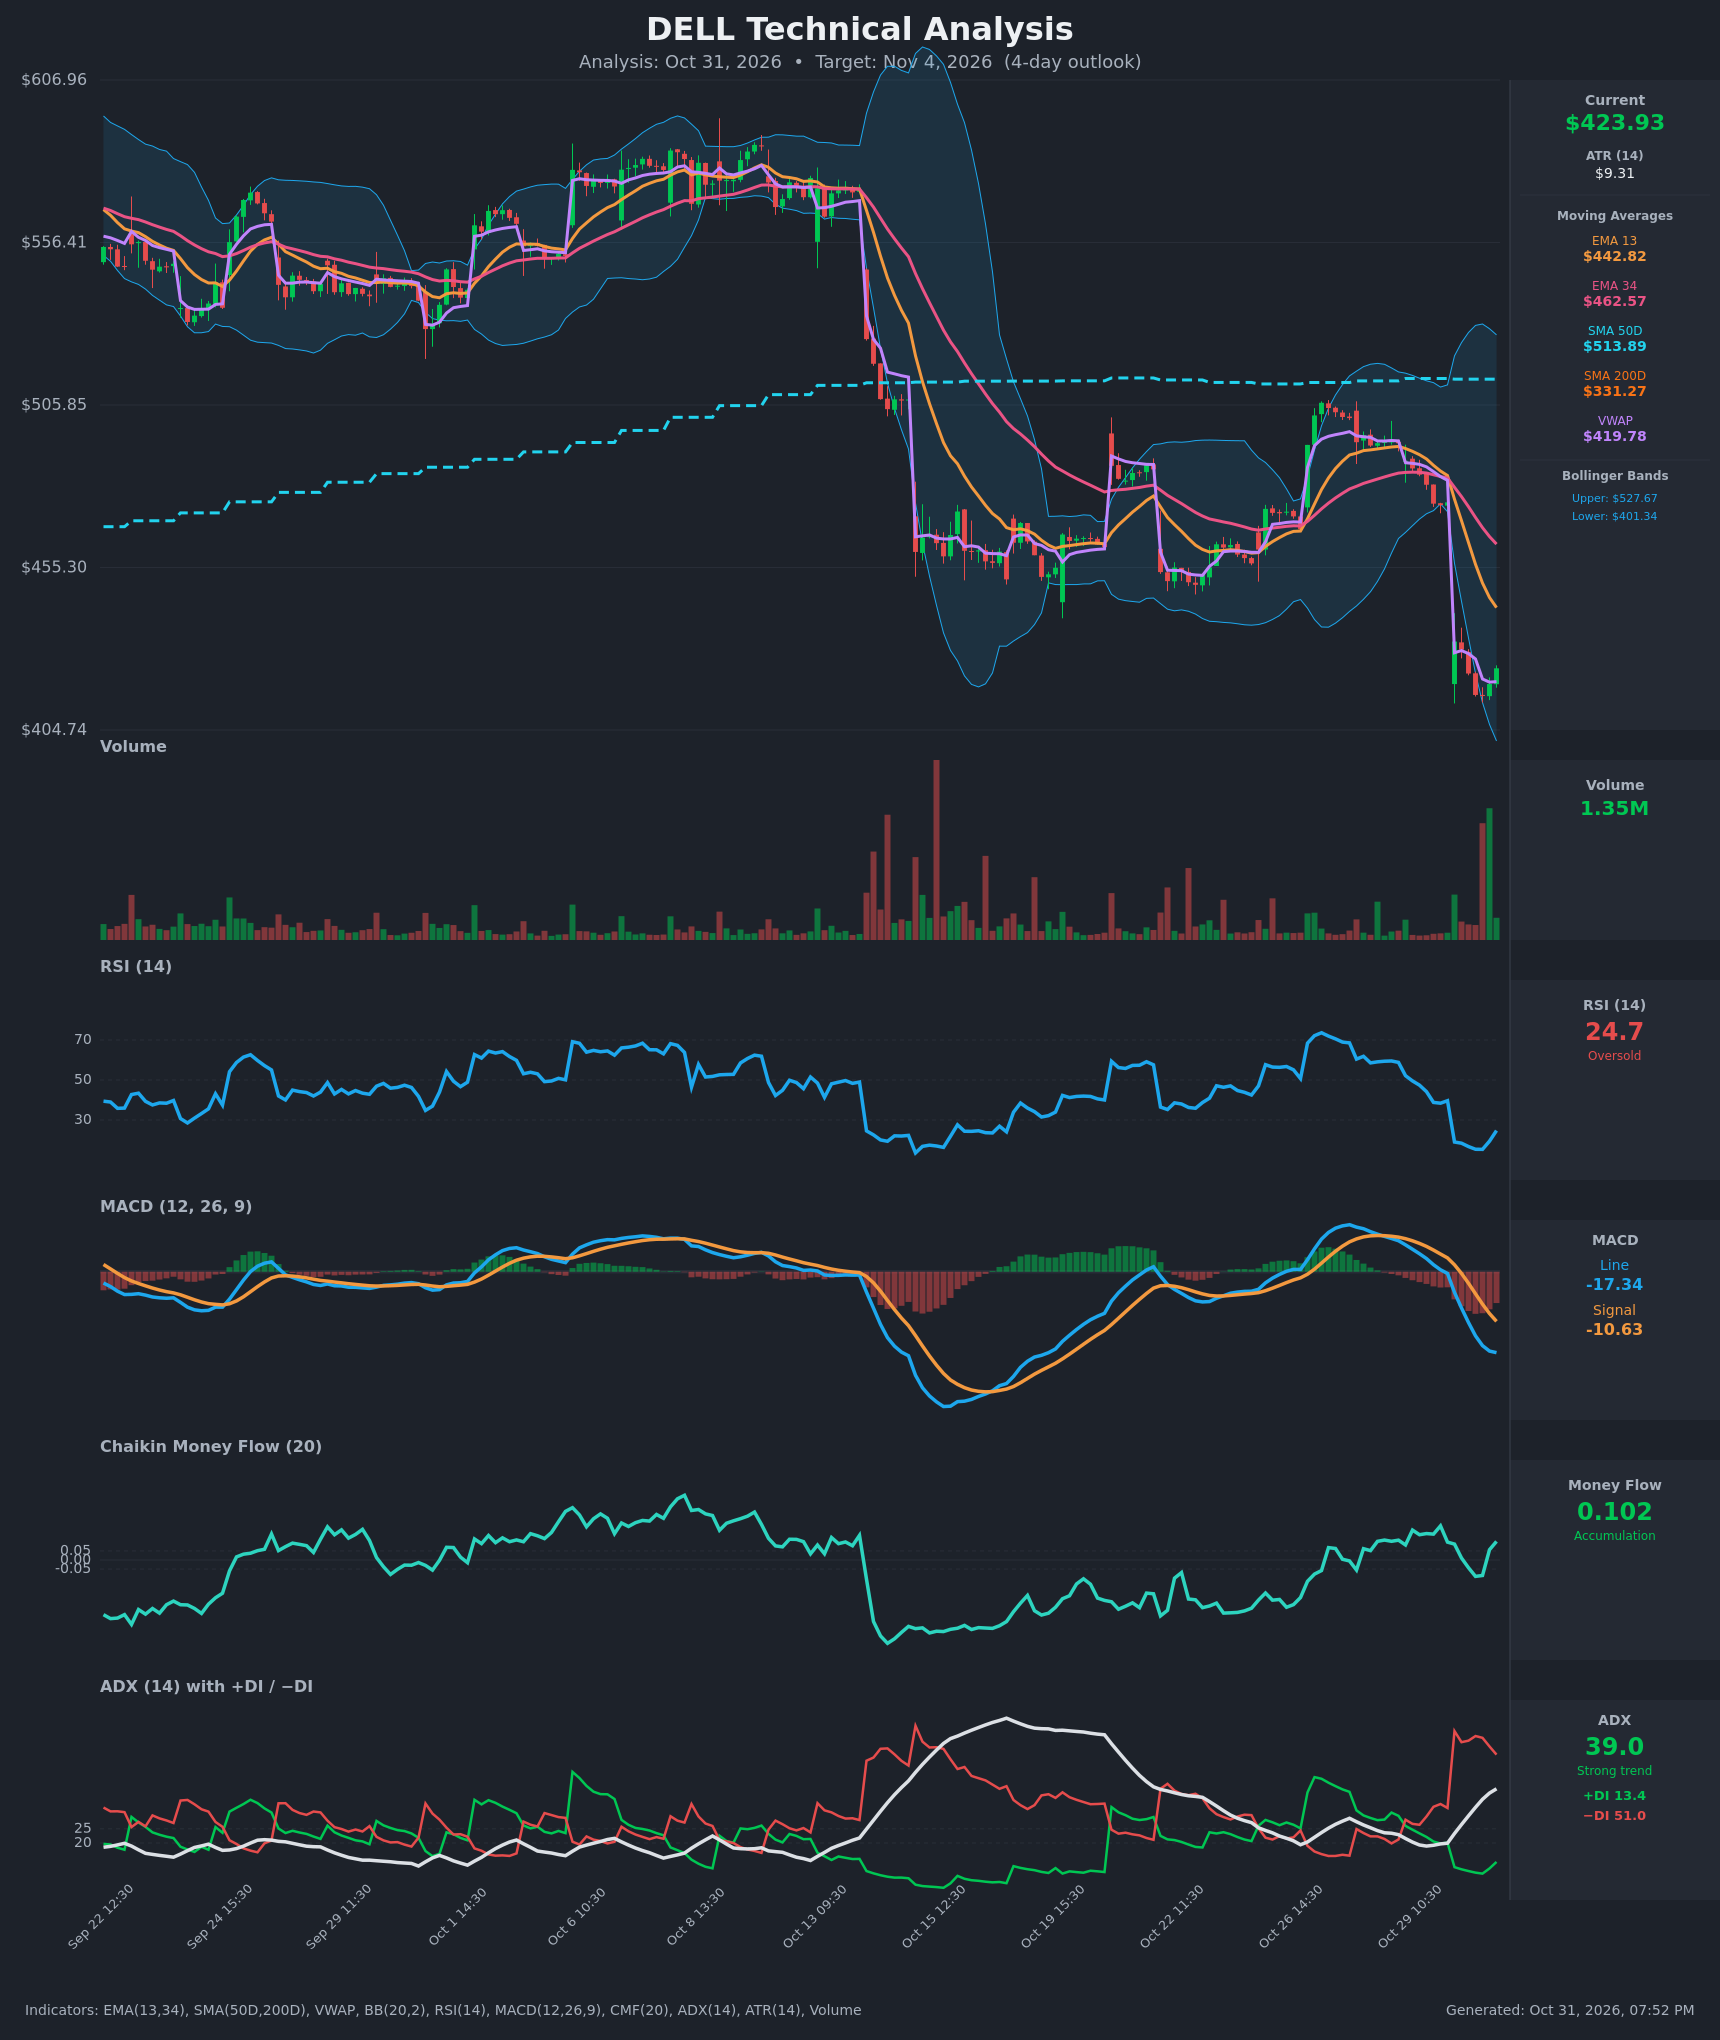
Analysis
TECHNICAL INDICATORS
- RSI (14): 24.71, bouncing from an extreme low of 15.3 on Oct 30 (13:30). It is still below 30, so oversold, but momentum has turned up for two bars. [Bullish]
- 20 EMA: Only EMA 13 ($442.82) and EMA 34 ($462.57) are supplied. Price is $423.93, well below both, and both are sloping down steeply. EMA 13 is below EMA 34, a bearish alignment, and the two are overhead resistance. [Bearish]
- MACD: Line -17.34 is below signal -10.63, so the histogram is negative at about -6.7. The bearish crossover happened on Oct 30 (09:30–10:30). The gap between line and signal is still widening, but the line's decline is flattening (-15.83, -17.00, -17.34). [Bearish]
- Bollinger Bands (20): Bands are $401.34 to $527.67, and the bands are very wide after the gap. Price is in the lower quarter of the band, about 18% of the way from the lower band, after riding or piercing it. Price is 5.6% above the lower band, so a bounce toward the midline is possible, though the midline (~$465) is far away. [Neutral]
- CMF (20): 0.102, back above +0.05 after dipping to -0.09. The last two bars were positive, which suggests dip buying or accumulation. [Accumulation]
- ADX (14): 39.0 and rising, with -DI 51.0 far above +DI 13.4. This is a strong downtrend, though the late bounce lifted +DI from 9.3 to 13.4 and -DI is rolling over from 59. [Strong Trend – Bearish]
- Volume: 1.35M on the latest bar, in line with recent hourly activity. The heavy selling on the gap-down bar (visible spikes on Oct 30) has faded, and the last bar is green. This looks like selling exhaustion rather than renewed distribution. [Neutral to mildly Bullish]
DIVERGENCES & TRENDS
- Moving averages: Price is below EMA 13, EMA 34 and SMA 50D ($513.89) and above SMA 200D ($331.27). The long-term uptrend is intact but the short-term trend is sharply down. SMA 50D is flat and well above price, so it is far-off resistance.
- Early bullish divergence: RSI rose from 15.3 to 24.7 and CMF turned positive while price only recovered from $415.44 to $423.93. This is a momentum recovery rather than a confirmed price divergence, but it shows selling pressure fading.
- Bearish backdrop: MACD remains below signal with no bullish cross. ADX is at 39 with -DI dominant. A gap-down of about 9% (from $475.57 to $432.26) happened in a single session.
- VWAP: Price ($423.93) is just above VWAP ($419.78), which is a small positive and shows buyers defending the post-gap level.
- Prior behavior: After the Oct 13 gap down on the chart, price stabilized and retraced a portion of the drop over several sessions, consistent with an oversold relief bounce.
CHART PATTERNS
- Bearish breakdown from consolidation: Price was in a tight rising range from Oct 22 to Oct 29, then broke down hard. This is closest to a failed bullish flag or bearish continuation, a measured-move-down breakdown, rather than a clean pattern from the reference sheet.
- Possible Bullish Double Bottom (early, unconfirmed): Lows at $415.44 (13:30) and $419.04 (14:30), with a recovery to $423.93. It would need a clear break above the post-gap level near $432 to confirm. The target would be roughly $440–$443, which coincides with EMA 13.
- Significance: A relief bounce into the $432–$443 zone is plausible, but the dominant trend is down, so rallies should meet resistance at the EMAs.
POTENTIAL SCENARIOS
- Scenario 1: Bullish Oversold Relief Bounce — RSI below 25 with a turn up, positive CMF and price above VWAP suggest a mean-reversion rally toward the post-gap level and EMA 13. Trigger: hold above $415 and close above $432. Target: $432–$440. Invalidation: close below $414. (50% probability)
- Scenario 2: Bearish Trend Continuation — ADX at 39 with -DI at 51 and a widening MACD gap mean sellers could resume and push price below the $415 low toward the lower Bollinger Band. Trigger: break below $415.44 on rising volume. Target: $401–$405. Invalidation: close above $434. (35% probability)
- Scenario 3: Neutral Base Building — Price chops between $415 and $432 as the market digests the gap. Trigger: low-volume, narrow-range sessions. Target: $420–$428. Invalidation: close outside $414–$435. (15% probability)
PRICE TARGETS
For the 4-day horizon the range is $415.00 to $435.00, a width of $20.00, or about 4.7% of the current price.
- Target Price: $428.50 (for 4 days from now)
- Expected Range: $415.00 to $435.00
- Key Levels: Support at $415.44, Resistance at $432.26 (gap-day open, with EMA 13 at $442.82 as the next ceiling)
OVERALL BIAS
OVERALL BIAS: BULLISH - RSI is extremely oversold and turning up, CMF has flipped to accumulation, and price is holding above VWAP near the lower Bollinger Band, which favors a modest relief bounce. Conviction is modest because ADX at 39 with -DI dominant and a bearish MACD keep the broader trend down, and EMA 13 and the $432 level should cap gains.
This is educational analysis and not financial advice.