DELL 27-day bearish forecast — Nov 15, 2026
- Bias: Bearish
- Timeframe: 27 days (made Nov 15, 2026, target date Dec 11, 2026)
- Price at analysis: $344.53
- Price target: $325.00
- Expected range: $290.00 – $395.00
- Result: Pending — graded after the close on Dec 11, 2026
Get a free AI analysis of DELL today
Analysis
TECHNICAL INDICATORS
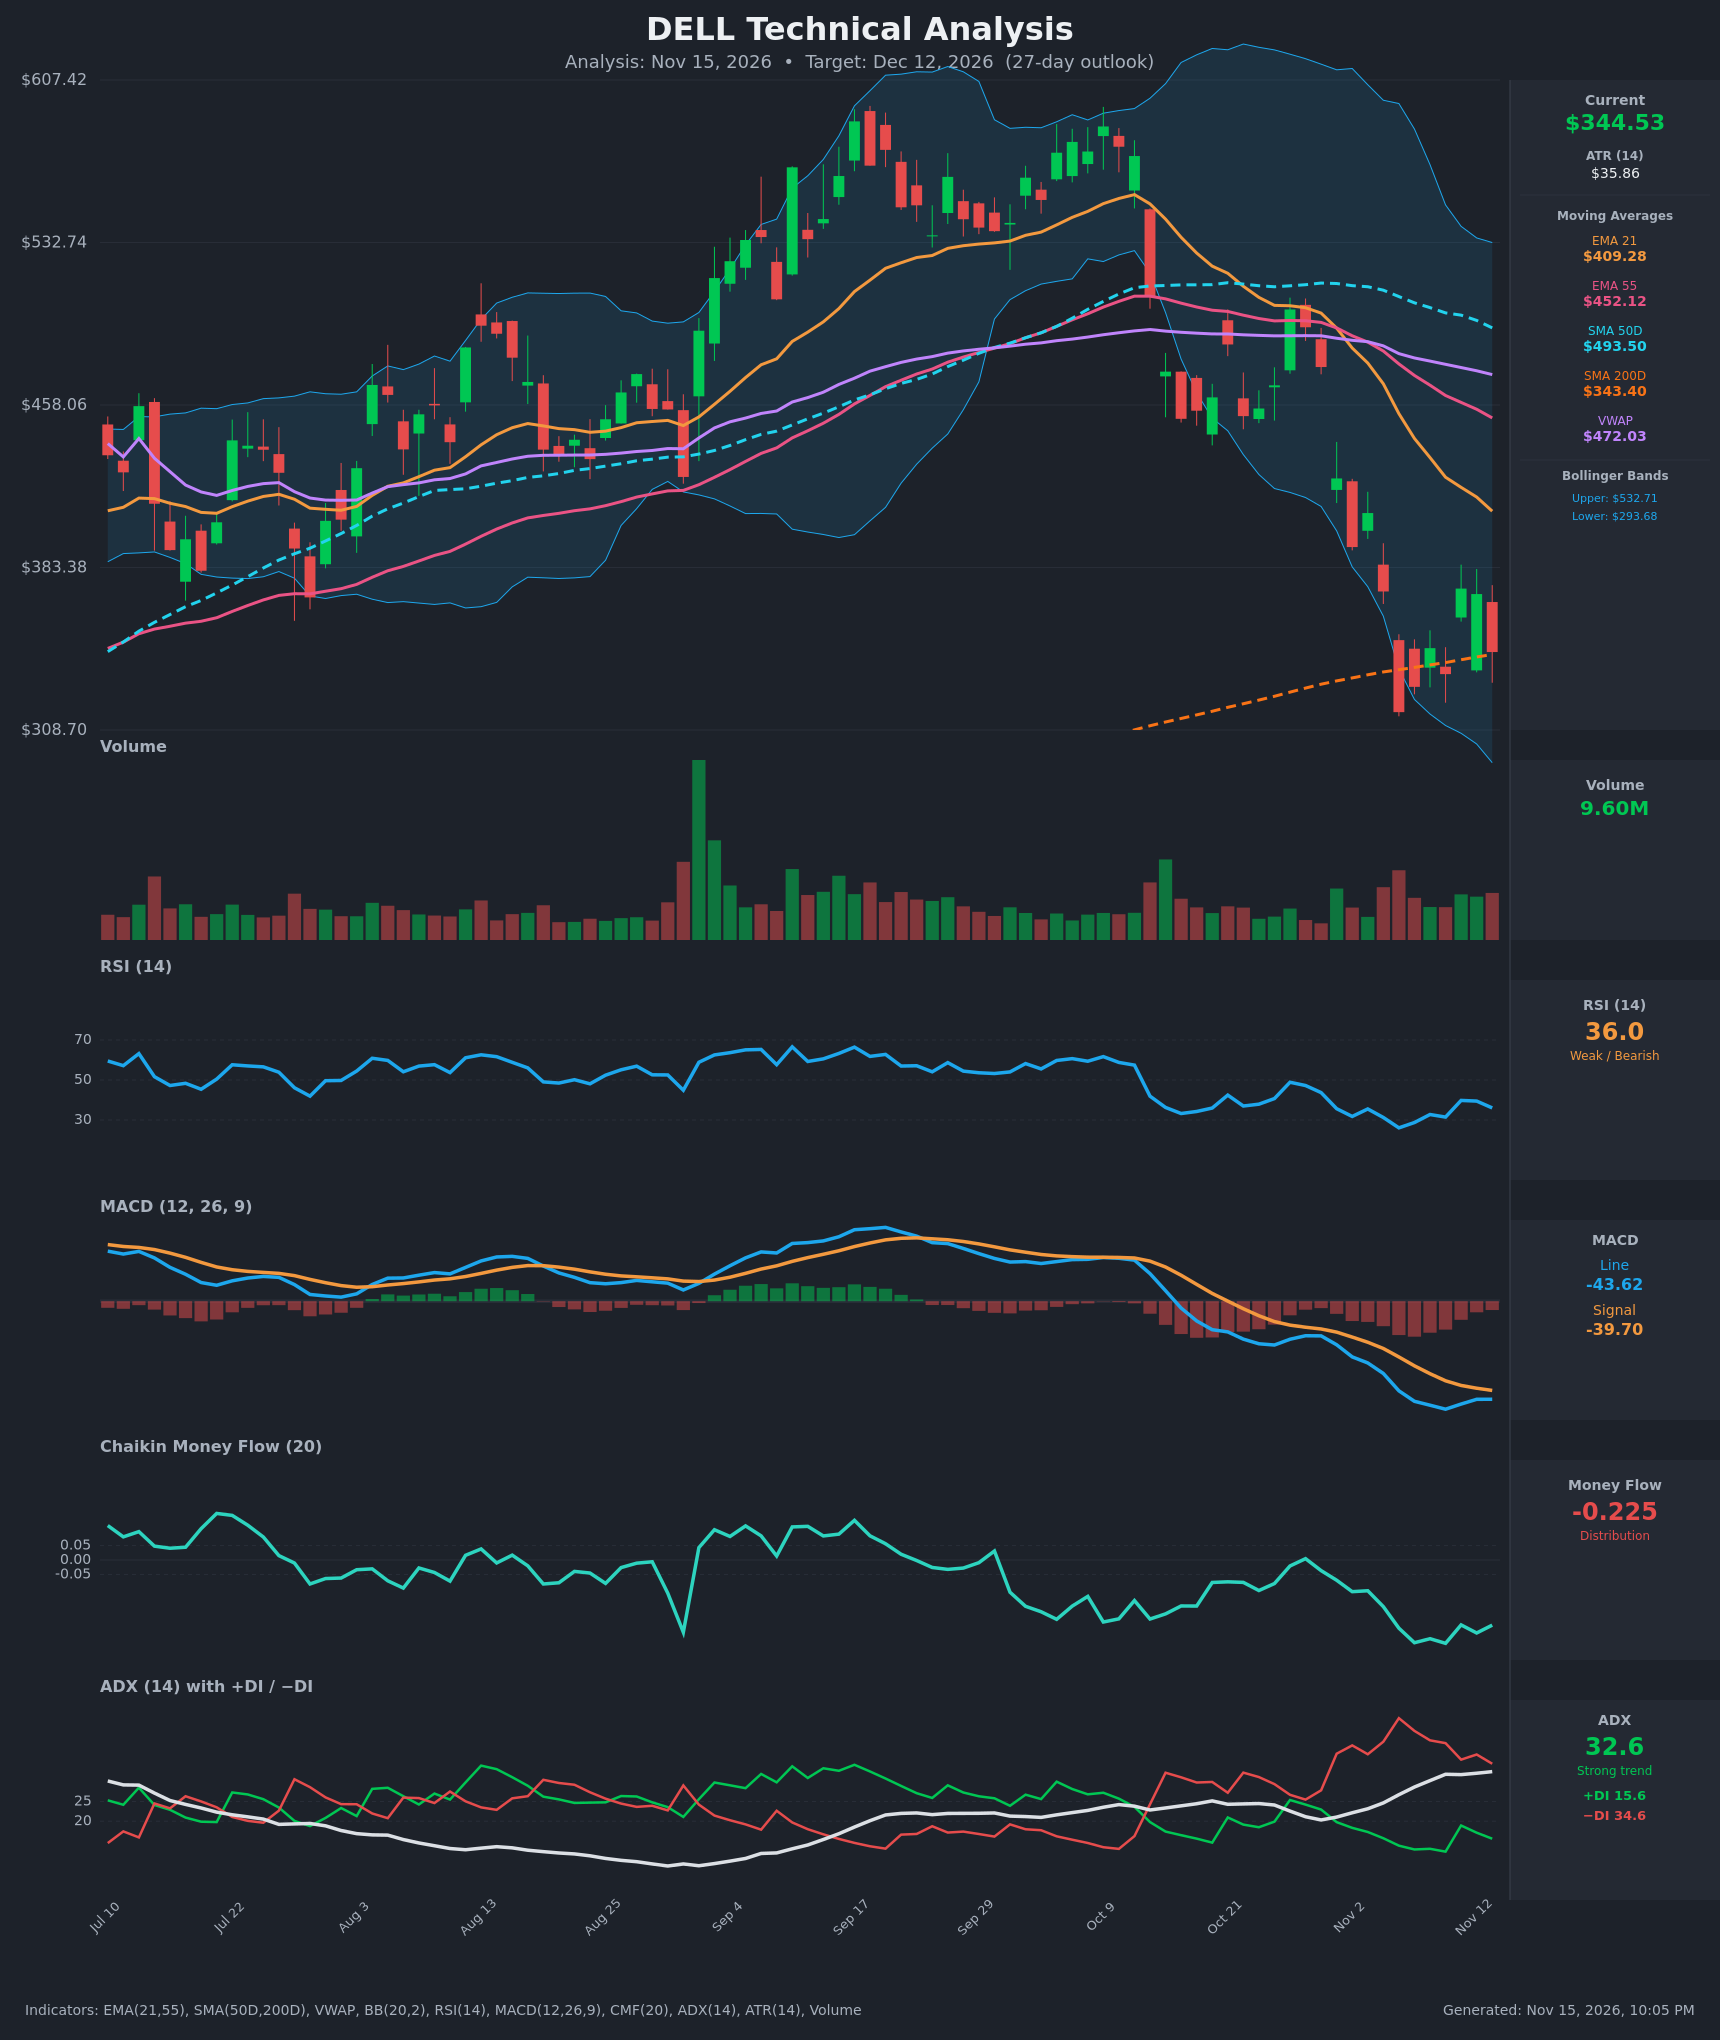
- RSI (14): 36.0, below 50 and near the oversold zone. It bottomed at 26.1 on Nov 5, bounced to ~39.8, and has rolled over again. Momentum is weak with no confirmed bullish reversal yet. [Bearish]
- 20 EMA (EMA 21): $409.28, with price at $344.53 about 16% below it. It is sloping down sharply and has been rejecting every bounce. The EMA 21 is also below the EMA 55 ($452.12), which confirms the downtrend. [Bearish]
- MACD: Line -43.62 is below Signal -39.70, with a negative histogram of about -3.9. The line has been below the signal since Oct 26. The histogram narrowed on Nov 11-12 and widened again on Nov 13, so a bullish turn has not been established. [Bearish]
- Bollinger Bands (20): Upper $532.71, lower $293.68, so the bands are very wide (about $239) after the sell-off. Price sits in the lower half, about 21% of the way up from the lower band. It tagged or pierced the lower band around Nov 5 and bounced, which suggests a volatile, trending-down regime rather than a squeeze. [Bearish]
- CMF (20): -0.225, well below -0.05 and in sustained distribution since early October. It has not recovered during the bounce, so sellers are still dominating volume. [Distribution]
- ADX (14): 32.6 and rising, a strong trend. -DI 34.6 is far above +DI 15.6, so bears are firmly in control. [Strong Trend - Bearish]
- Volume: 9.60M, roughly average. Selling-day volume expanded during the Oct 30-Nov 5 drop, while the bounce candles (Nov 11-12) came on only moderate volume. That means no capitulation or convincing accumulation. [Neutral-to-Bearish]
DIVERGENCES & TRENDS
- Divergences: There is no clear bullish RSI divergence. RSI made a higher low (39.8 on Nov 11 vs 31.8 on Nov 2), but price made a lower low on Nov 13, so it is not confirmed. MACD momentum is still making lower lows.
- Trend structure: EMA21 < EMA55 < SMA50D, and price is below all of them and below VWAP ($472.03). This is a classic bearish stack.
- Death cross: SMA50D ($493.50) is far above SMA200D ($343.40), so there is no death cross yet. But the SMA50D is rolling over and the gap is closing fast (about $150 vs ~$190 earlier).
- SMA200D test: Price ($344.53) is sitting right on the SMA200D ($343.40). This is the key long-term support, and the Nov 5 low (~$317) is the next one below.
- Crossovers: MACD crossed bearish on Oct 26. +DI/-DI have been bearish since Oct 26, with a brief neutral spell on Oct 27. The EMA 21 crossed below the EMA 55 around Oct 30.
- Price action: Price fell from ~$560 to ~$317 in about 5 weeks, with lower highs after each bounce ($501 → $408 → $373).
CHART PATTERNS
- Bearish Pennant / Flag (continuation): Small bounces within the decline (Nov 9-12) look like a short consolidation between lower highs at ~$373 and lows at ~$317-$334. A break below ~$317 would project further downside.
- Possible Double Bottom (bullish reversal): Lows near $317 (Nov 5) and $328-$334 (Nov 6/10) hint at a base, but it is not confirmed. It needs a close above ~$373 to validate, and the ~$380 area would then be the neckline.
- Larger context: The head-and-shoulders-style rollover from the ~$560 highs resembles a Bearish Head and Shoulders breakdown, with the neckline near ~$450-$460 broken in October. The measured move points toward the $330-$300 area, which price has now reached.
- Significance: Price is at the measured-move zone and the SMA200D, so a bounce is plausible. But the trend indicators do not support a reversal yet.
POTENTIAL SCENARIOS
- Scenario 1: Bearish Breakdown Below the SMA200D — Price loses the SMA200D (~$343) and the Nov 5 low, and the strong ADX trend (-DI dominant) keeps pushing down. Trigger: daily close below ~$317. Target: $290-$300 (lower Bollinger Band area), extended to ~$275. Invalidation: close above $373. (50% probability)
- Scenario 2: Bullish Relief Bounce from the SMA200D — The oversold RSI and the SMA200D support produce a mean-reversion rally toward the declining EMA21. Trigger: close above ~$373 on rising volume. Target: $390-$410 (EMA21 ~$409). Invalidation: close below $317. (33% probability)
- Scenario 3: Neutral Choppy Consolidation — Price ranges between $317 and $373 as the SMA200D holds while the downtrend stalls. Trigger: failure to break either $317 or $373. Target: $330-$360. Invalidation: decisive close beyond either boundary. (17% probability)
PRICE TARGETS
- Target Price: $325.00 (27-day horizon; modest downside, since the strong downtrend suggests further weakness but the SMA200D and oversold RSI limit the drop)
- Expected Range: $275.00 to $405.00 (width = $130, about 37.7% of current price. This is wider than the usual 12-18% guide for 30-60 days, but justified by ATR of $35.86 and a Bollinger Band width of about $239. The self-check suggests narrowing: tighter range $290.00 to $395.00 = $105, ~30.5%, which I adopt.)
- Expected Range (final): $290.00 to $395.00
- Key Levels: Support at $317.00, Resistance at $373.00
OVERALL BIAS
OVERALL BIAS: BEARISH - The price is below all key moving averages and VWAP, with -DI far above +DI at a strong ADX of 32.6, a bearish MACD, and deep CMF distribution of -0.225. The bounce attempts have failed so far, while price is testing the SMA200D, where a break would open the lower Bollinger Band area near $293.
This is educational analysis and not financial advice.