DELL 48-day bearish forecast — Nov 15, 2026
- Bias: Bearish
- Timeframe: 48 days (made Nov 15, 2026, target date Jan 1, 2027)
- Price at analysis: $344.53
- Price target: $315.00
- Expected range: $288.00 – $345.00
- Result: Pending — graded after the close on Jan 1, 2027
Get a free AI analysis of DELL today
Analysis
TECHNICAL INDICATORS
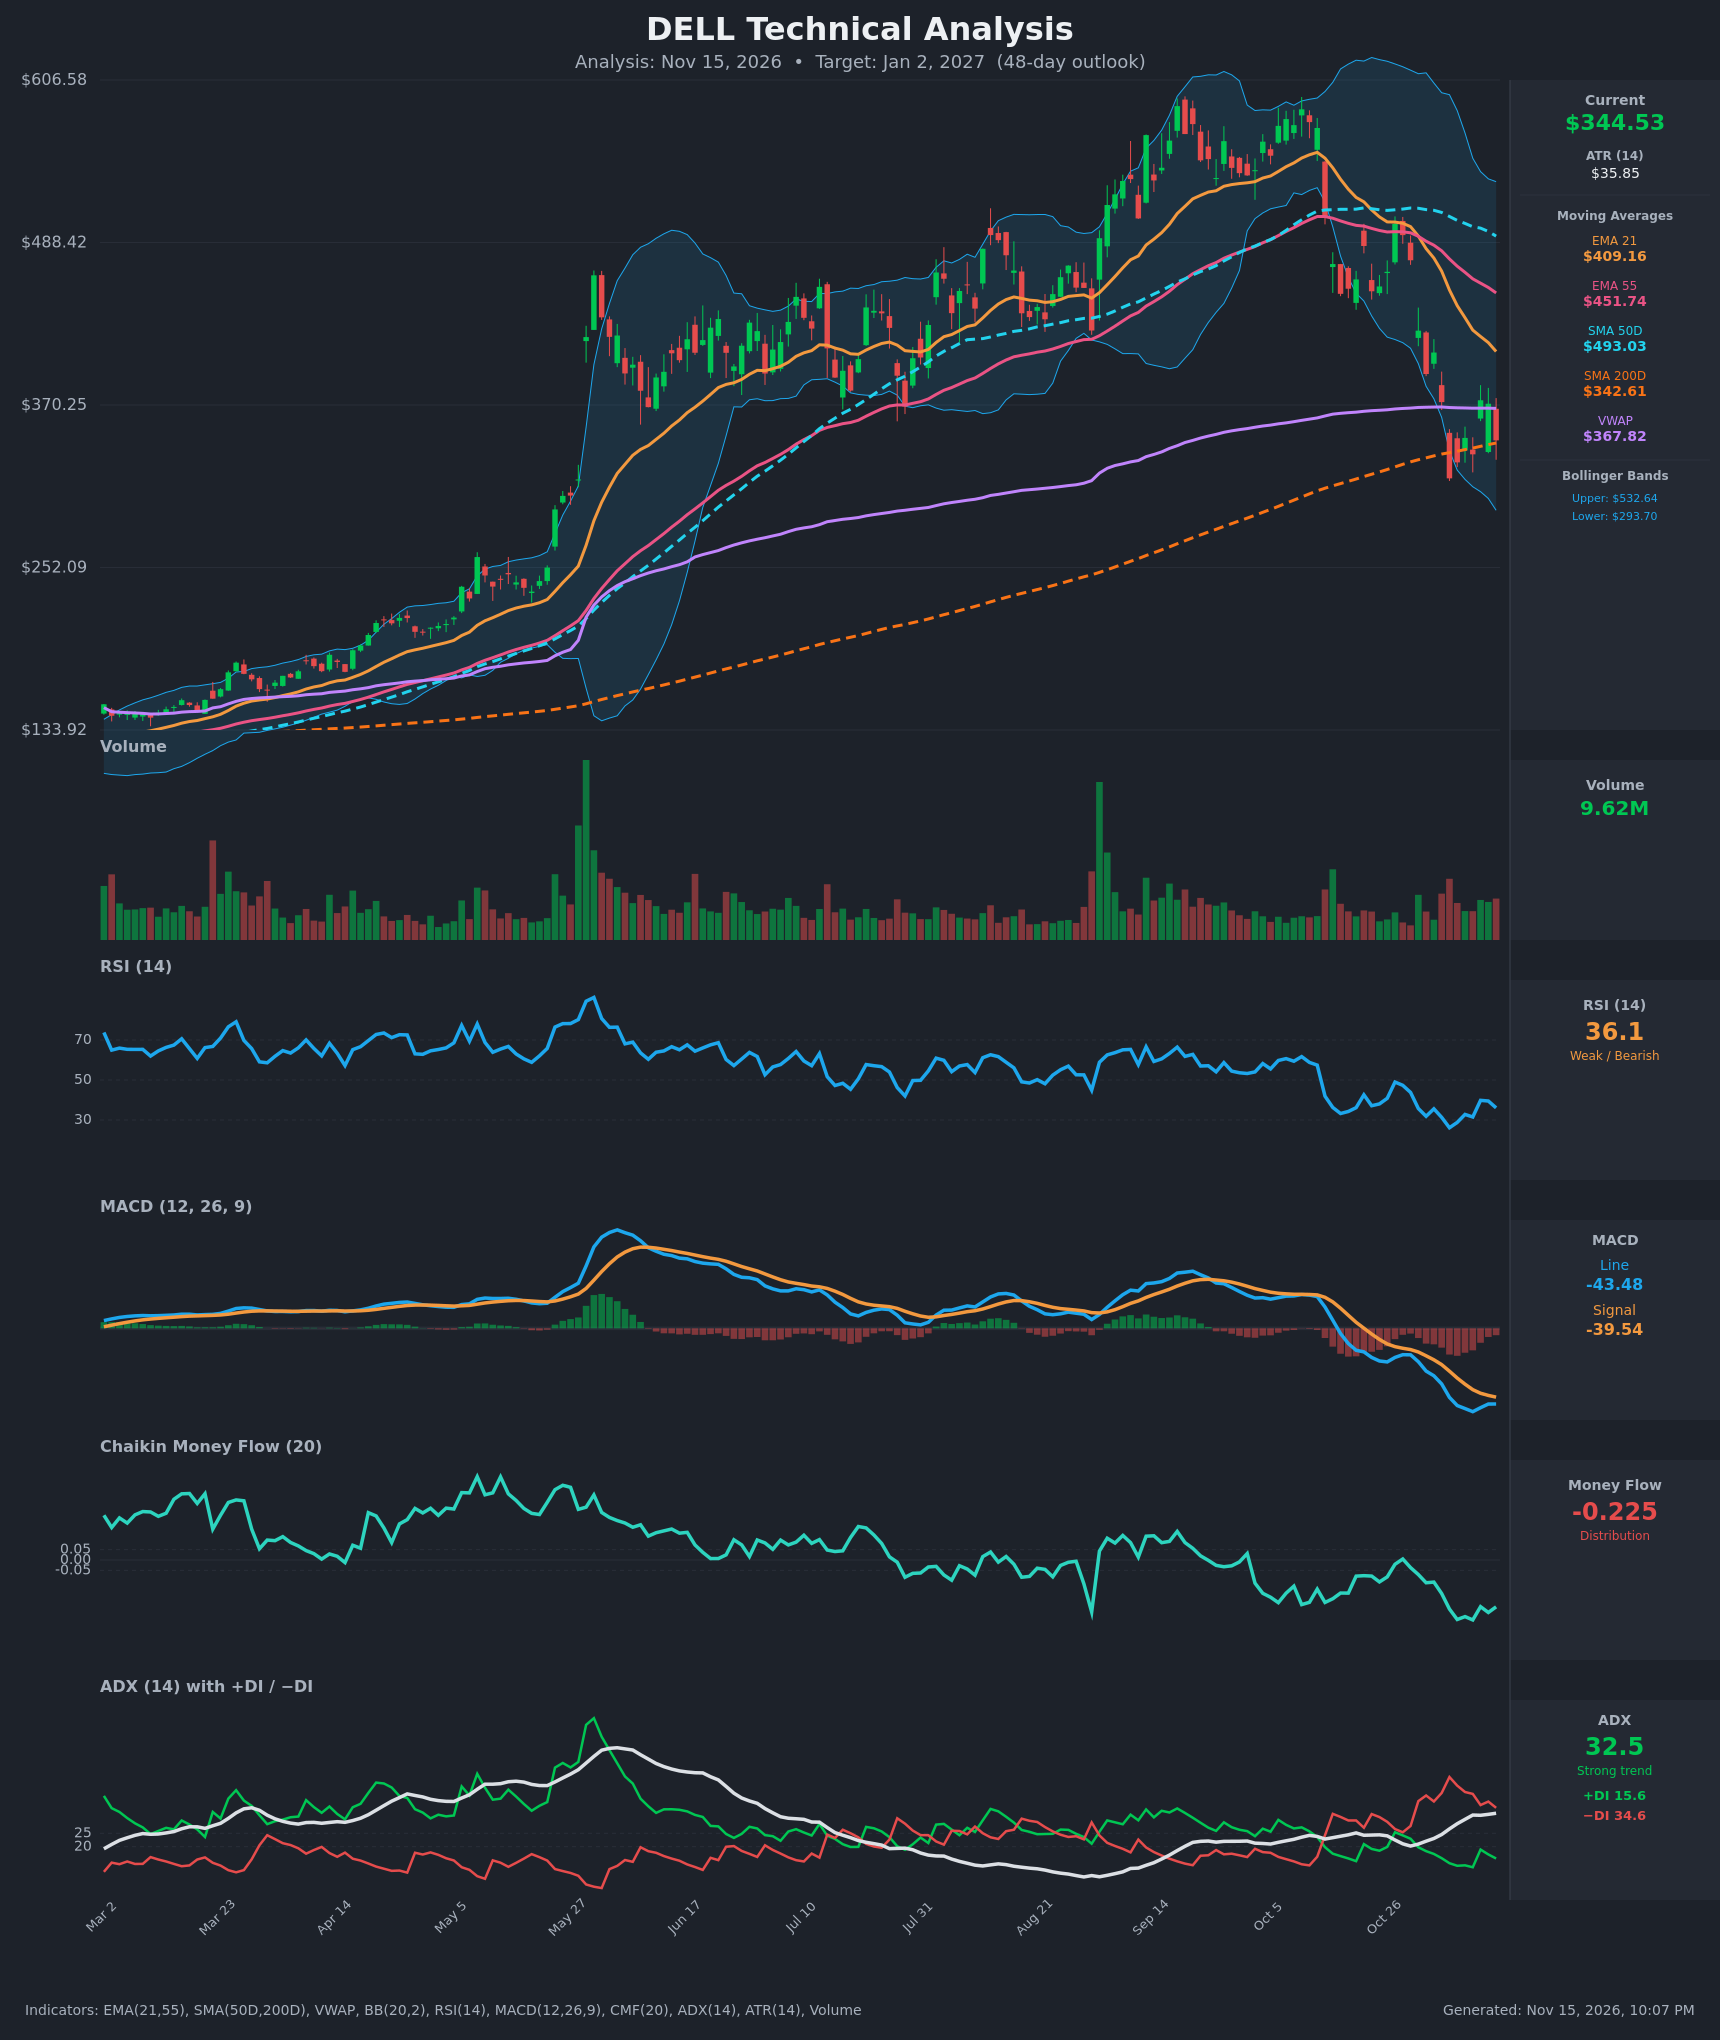
- RSI (14): 36.08, down from about 40 on Oct 26 and with a low of 26.1 on Nov 5. The bounce to 39.8 on Nov 11 failed and RSI is rolling over again. It is weak but not yet oversold, so there is room for further downside before a washout. [Bearish]
- 20 EMA: The chart uses an EMA 21 at $409.16, with price at $344.53 well below it (about 16% under). The EMA is falling steeply and is acting as overhead resistance. EMA21 also crossed below EMA55 ($451.74) around Oct 30, a bearish crossover. [Bearish]
- MACD: Line -43.48 is below the signal at -39.54, so the histogram is negative. The line has been below the signal since Oct 26 and made new lows on Nov 10 (-47.9). The slight narrowing of the gap on Nov 11-12 has stalled, and the gap widened again on Nov 13. [Bearish]
- Bollinger Bands (20): Upper $532.64, lower $293.70, midpoint about $413. Price is in the lower half, well below the midline. The bands are wide after the sharp selloff, and the Nov 5 low ($316.91) tagged the lower band area. Price has not reclaimed the midline, and walking the lower half of the bands is typical of a downtrend. [Bearish]
- CMF (20): -0.225, well below the -0.05 threshold and negative for the whole decline (from -0.08 to as low as -0.29). Distribution is persistent and no accumulation has appeared on the bounce. [Distribution]
- ADX (14): 32.5 and rising (from 20.2 on Oct 29), with −DI at 34.6 above +DI at 15.6. That is a strong, established downtrend with bears firmly in control. The one bounce (Nov 11) only lifted +DI to 18.9. [Strong Trend – Bearish]
- Volume: 9.62M, which is average to modest. The heavy-volume selling days were the breakdown legs (Oct 30 through Nov 5), and the bounces have come on lighter, unconvincing volume. There is no capitulation spike. [Mildly Bearish / No Capitulation]
DIVERGENCES & TRENDS
- Price vs RSI: No bullish divergence yet. RSI made a low of 26.1 on Nov 5 against a price low of $316.91. The Nov 13 close ($344.53) is above that low, but RSI (36.1) is also above 26.1, so the two are confirming each other.
- Price vs MACD: The MACD low of -47.9 on Nov 10 came with price near $334, higher than the Nov 5 low. This is a mild sign of selling exhaustion, but MACD has not crossed up. The histogram is still negative.
- MA structure: Price is below EMA21 ($409), EMA55 ($452), SMA50D ($493) and VWAP ($368), and it is sitting on the SMA200D ($342.61). All shorter averages are falling and stacked in bearish order.
- SMA gap: SMA50D ($493) is rolling over toward SMA200D ($342.61). The gap is still large, so a death cross is not imminent, but a loss of SMA200D would significantly worsen the technical picture.
- Price action: After peaking near $590, price made a series of lower highs and lower lows ($501.96, then $408.40, then $373.68). The Nov 11 rally was rejected below VWAP at $373.68.
- CMF and ADX: CMF at -0.225 and a rising ADX with −DI dominance confirm that the trend is strengthening.
- Trend sequence: The MACD bearish crossover (Oct 26), EMA21/55 death cross (Oct 30) and −DI dominance are all in place.
CHART PATTERNS
- Broad top / rounded reversal: The Aug-Oct advance to about $590 followed by a lower-high rollover resembles a Bearish Head and Shoulders / distribution top. The sharp breakdown through EMA21, EMA55 and SMA50D confirms the reversal.
- Bearish flag / pennant (developing): The tight $317-$374 consolidation after the Oct 30 - Nov 5 drop resembles a Bearish Flag/Pennant. Its lower boundary is near $317-$343 (the Nov 5 low and SMA200D). A break below projects a measured move of roughly $40-$60 below that area, toward $280-$300.
- Key support: SMA200D at $342.61 is the last major trend-line support. A decisive close below it, and then below $316.91, would likely accelerate the decline toward the lower Bollinger Band zone (~$294) and below.
- Bullish counter-case: A bullish double bottom needs a hold of $317 and a close above $374, which has not happened.
POTENTIAL SCENARIOS
- Scenario 1: Bearish Breakdown Below SMA200 — Bears continue to control the trend, and SMA200D support fails after a weak bounce into resistance. Trigger: daily close below $342.61, then below $316.91. Target: $295-$315, with an extension toward $280. Invalidation: daily close above $374 (the Nov 11 high and VWAP). (55% probability)
- Scenario 2: Bullish Relief Bounce off SMA200 — The oversold bounce holds the 200-day average and $317 and squeezes toward the declining EMA21. Trigger: close above $374 with CMF improving and MACD histogram turning up. Target: $405-$410 (EMA21), with possible extension to $450 (EMA55). Invalidation: close below $316.91. (30% probability)
- Scenario 3: Neutral Range Between $317 and $374 — Price chops between the Nov 5 low and VWAP while ADX cools. Trigger: failure to break either side. Target: $335-$355. Invalidation: close outside the $317-$374 range. (15% probability)
PRICE TARGETS
- Target Price: $315.00 (48-day horizon, around Jan 2, 2027)
- Expected Range: $288.00 to $345.00 (width $57, about 16.5% of current price, in line with the 30-60 day guidance)
- Key Levels: Support at $316.91 (Nov 5 low, with SMA200D at $342.61 as first line just below price), Resistance at $367.82 (VWAP, with the Nov 11 high at $373.68 above it)
OVERALL BIAS
OVERALL BIAS: BEARISH - Price is in a strong downtrend (ADX 32.5, −DI 34.6 vs +DI 15.6), below every key moving average and VWAP, with a bearish MACD, persistent distribution (CMF -0.225) and RSI still above oversold. The SMA200D at $342.61 is the last major support, and a loss of it opens $295-$315.
This is educational analysis and not financial advice.