DELL 20-day bearish forecast — Nov 15, 2026
- Bias: Bearish
- Timeframe: 20 days (made Nov 15, 2026, target date Dec 4, 2026)
- Price at analysis: $344.53
- Price target: $328.00
- Expected range: $308.00 – $347.00
- Result: Pending — graded after the close on Dec 4, 2026
Get a free AI analysis of DELL today
Analysis
TECHNICAL INDICATORS
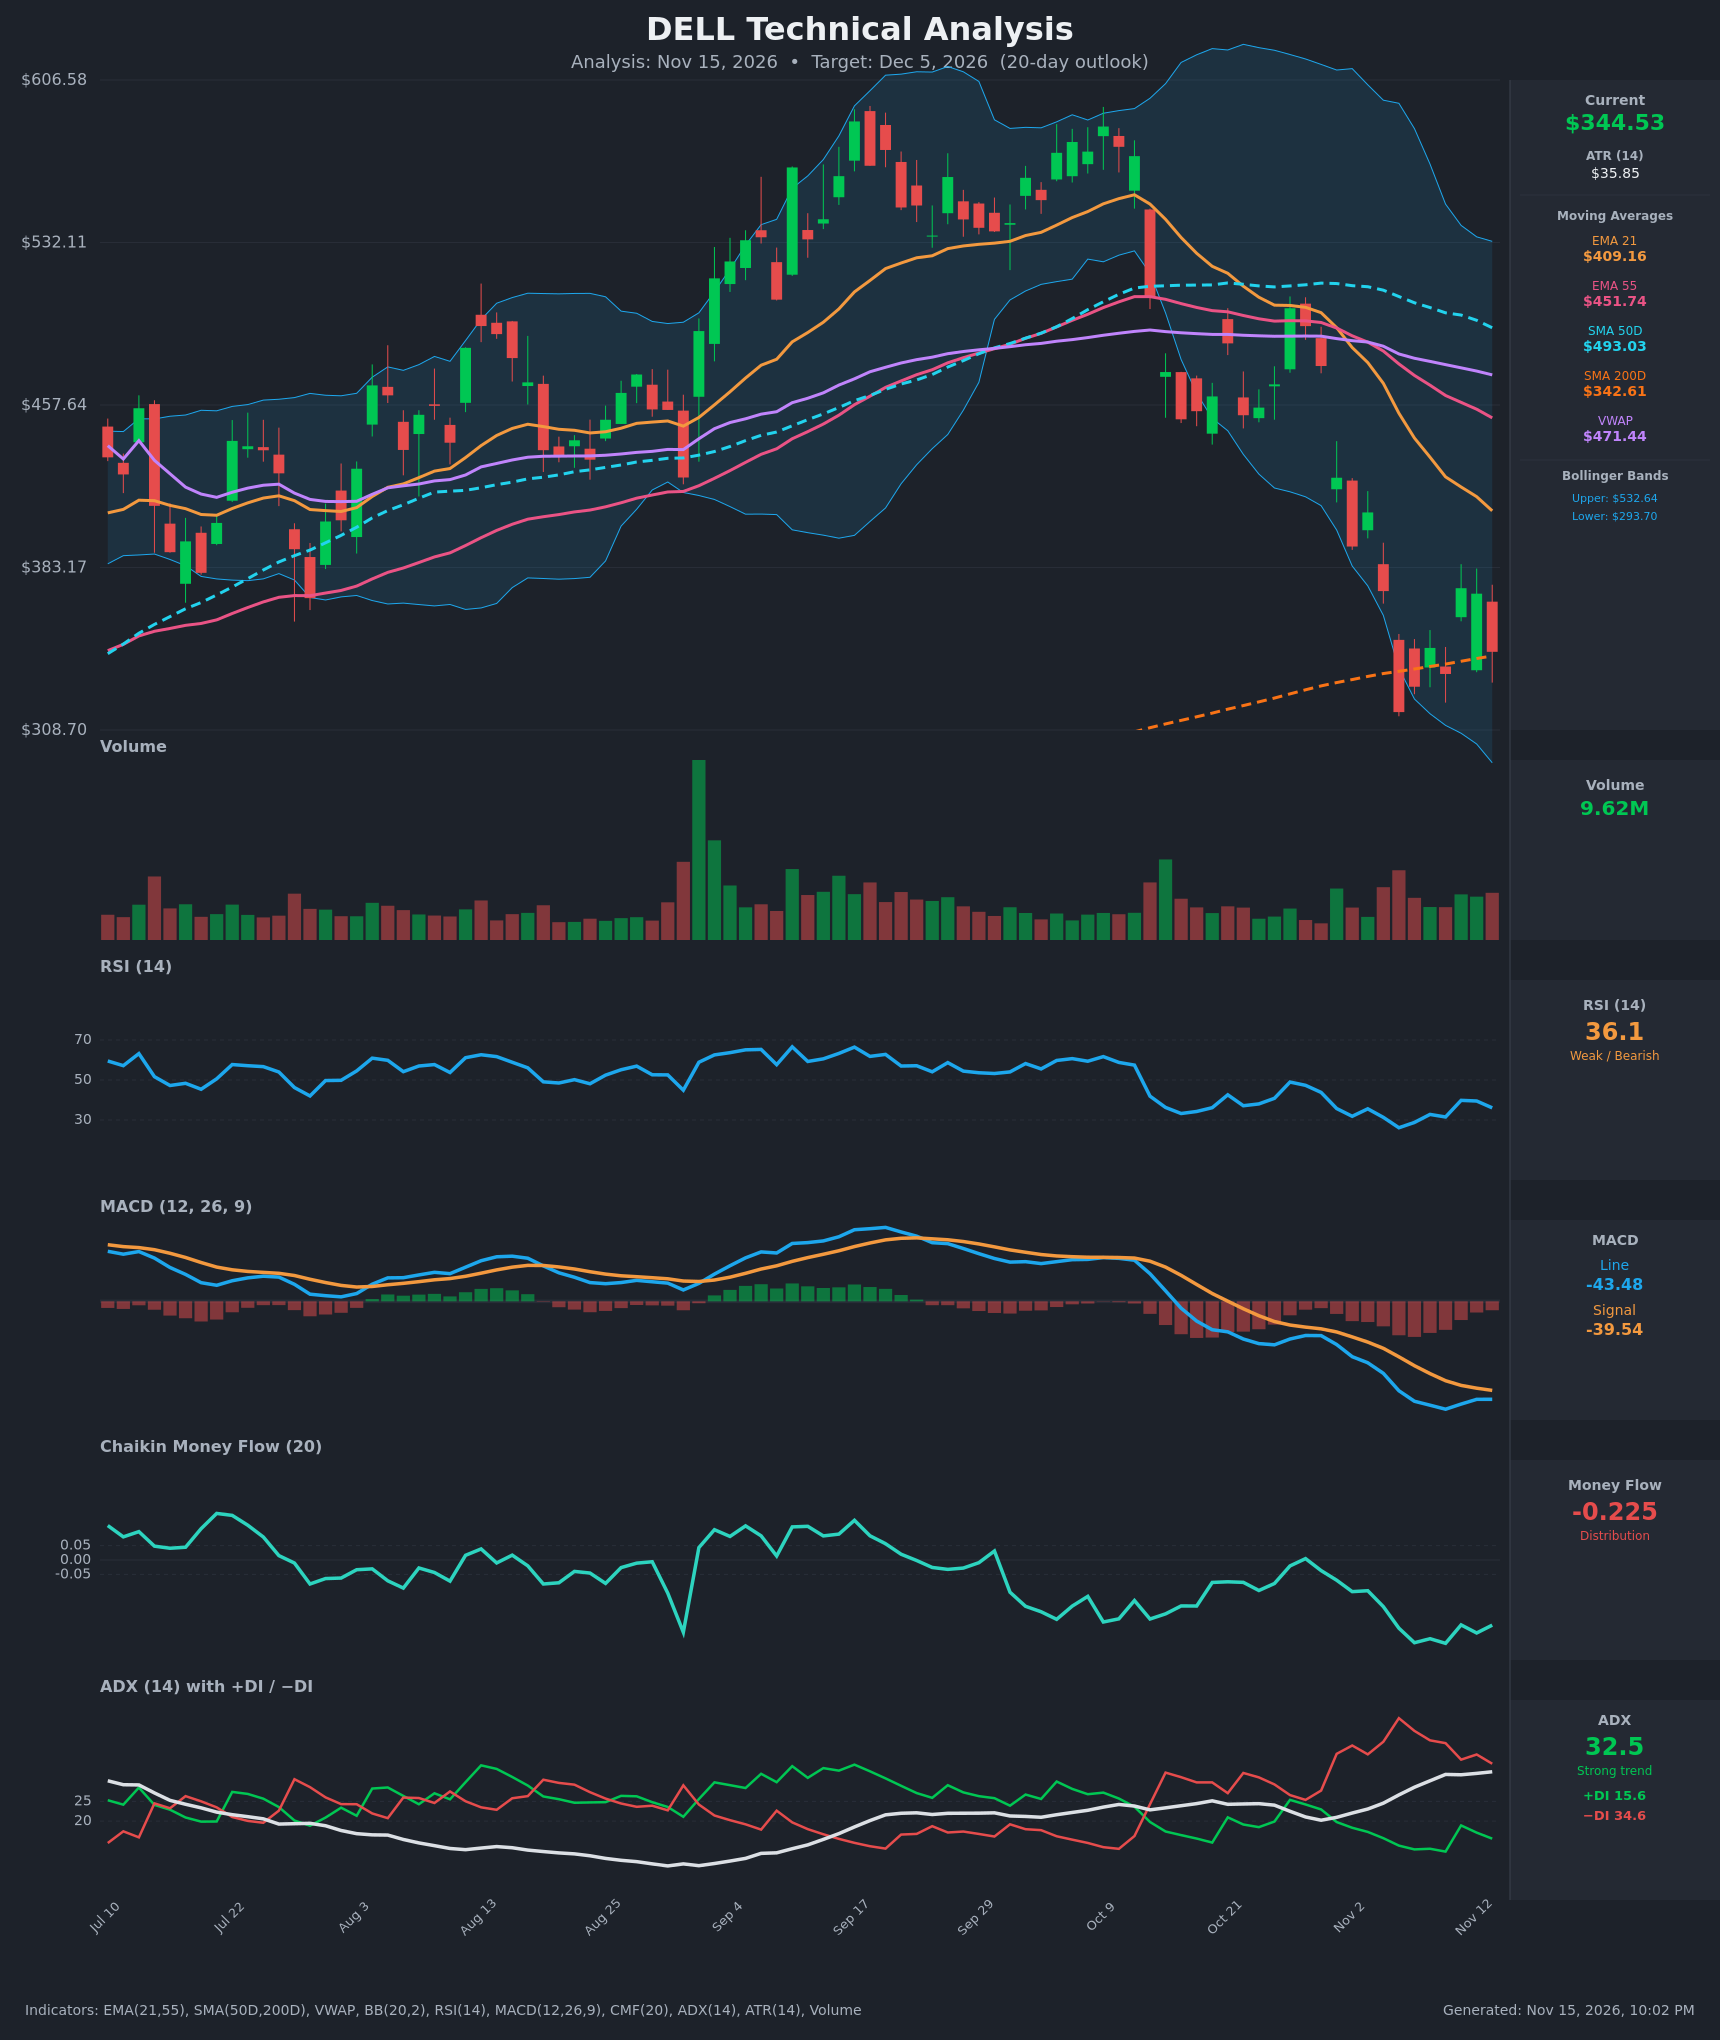
- RSI (14): 36.08, below 50 and near oversold but not yet under 30. It bottomed at 26.1 on Nov 5, bounced to ~39.8, and has rolled over again. Momentum is weak but stabilizing relative to the prior low. [Bearish]
- 20 EMA (EMA 21): $409.16, about 19% above price and falling steeply. EMA21 is also below EMA55 ($451.74) and SMA50D ($493.03), so the short-term stack is fully bearish. EMA21 is overhead resistance. [Bearish]
- MACD: Line -43.48 is below signal -39.54 and well below zero, so the histogram is negative at about -3.9. The histogram has narrowed sharply from about -12.6 on Nov 10, and the line is flattening. That is a hint of selling exhaustion, but there is no bullish crossover yet. [Bearish]
- Bollinger Bands (20): Upper $532.64, lower $293.70, with price in the lower half of the bands. Price tagged or pierced the lower band during the Nov 5 flush and has since bounced back inside. The bands are very wide, reflecting high volatility after the breakdown. Price is far below the midline (~$413), so a mean-reversion bounce is possible, but the trend is still pulling price down the lower half. [Bearish]
- CMF (20): -0.225, far below -0.05. It has been negative for weeks and is making new lows, showing persistent distribution with no sign of accumulation. [Distribution]
- ADX (14): 32.5 and rising, so this is a strong trend. −DI (34.6) is far above +DI (15.6), meaning bears are firmly in control. The trend is down. [Strong Trend – Bearish]
- Volume: 9.62M, with heavy volume on the big red breakdown days in late Oct and early Nov and only modest volume on the bounces. The Nov 13 close back down from $371 on decent volume shows sellers still active. VWAP ($471.44) is far above price, so most recent buyers are underwater. [Bearish – selling pressure dominates]
DIVERGENCES & TRENDS
- Bullish RSI divergence (minor): The Nov 5 low was $316.91 with RSI 26.1. The Nov 10 close was $334.38 with RSI 31.5, a higher price low and a higher RSI low. This signals fading downside momentum.
- MACD histogram: It is contracting from the Nov 10 extreme, but the MACD line is still below the signal line and has not crossed.
- Lower high: The bounce failed at $373.68 (Nov 11), well below the prior swing high near $408 (Nov 3). Price rolled over to $344.53 on Nov 13, so the bounce looks corrective rather than a reversal.
- Death cross status: SMA50D ($493) is far above SMA200D ($342.61). That is not a death cross, but the gap is closing fast as the 50D rolls over.
- SMA200D test: Price sits right on SMA200D ($342.61), the key long-term support. It dipped below on Nov 5-6 and reclaimed it, so the level is being defended so far.
- Trend indicators: ADX is rising (21 → 32.5) with −DI dominant, and CMF is making new lows. Both confirm the downtrend rather than diverging from it.
CHART PATTERNS
- Bearish continuation (flag/pennant-like or descending-triangle structure): After the steep drop from ~$560 to ~$317, price has formed a choppy range with a lower high at $373.68 and support in the $317-$335 zone. This resembles a Bearish Pennant or Descending Triangle. A breakdown below ~$317 would project roughly a measured move toward the high-$200s.
- Possible bullish Double Bottom (lower probability): Lows near $317 (Nov 5) and ~$334 (Nov 10), together with the RSI divergence and the SMA200D hold, could form a double bottom. It needs a close above the $373.68 neckline to confirm, and that has not happened.
- Significance: The bearish continuation read has more evidence behind it (trend strength, CMF, DI, lower highs), but the SMA200D and oversold conditions make sharp relief rallies likely along the way.
POTENTIAL SCENARIOS
- Scenario 1: Bearish Continuation Below the 200-Day SMA — Price fails to hold SMA200D (~$342.61) as the −DI and distribution trends persist, then retests the Nov 5 low. Trigger: daily close below $342 and then below $330 on rising volume. Target: $316.91 first, with an extension to ~$300 near the lower Bollinger Band ($293.70). Invalidation: daily close above $373.68. (50% probability)
- Scenario 2: Bullish Oversold Bounce / Double Bottom — The SMA200D holds, RSI divergence and the narrowing MACD histogram play out, and price mean-reverts toward the falling EMA21. Trigger: close above $373.68 with MACD crossing above signal. Target: $395-$409 (EMA21). Invalidation: close below $316.91. (35% probability)
- Scenario 3: Neutral Range Chop — Price oscillates between SMA200D support and the $373 lower high, with ADX fading from its peak. Trigger: failure to break either $317 or $374 for the full window. Target: $335-$360. Invalidation: decisive break of either boundary. (15% probability)
PRICE TARGETS
Timeframe: 20 days (target date Dec 5, 2026).
- Target Price: $328.00
- Expected Range: $308.00 to $347.00 (width $39 ≈ 11.3% of current price, consistent with the 14-21 day guidance)
- Key Levels: Support at $316.91 (Nov 5 low; SMA200D at $342.61 is the first line just below price), Resistance at $373.68 (Nov 11 bounce high; EMA21 at $409.16 is the next hurdle)
OVERALL BIAS
OVERALL BIAS: BEARISH - ADX of 32.5 with −DI far above +DI, deepening CMF distribution (-0.225), a MACD below signal and zero, and price below every EMA and VWAP with a lower-high bounce all favor continued downside. The bullish RSI divergence and the SMA200D hold argue for sharp rebounds along the way, so conviction is modest.
This is educational analysis and not financial advice.