DELL 62-day bearish forecast — Nov 15, 2026
- Bias: Bearish
- Timeframe: 62 days (made Nov 15, 2026, target date Jan 15, 2027)
- Price at analysis: $344.53
- Price target: $318.00
- Expected range: $270.00 – $370.00
- Result: Pending — graded after the close on Jan 15, 2027
Get a free AI analysis of DELL today
Analysis
TECHNICAL INDICATORS
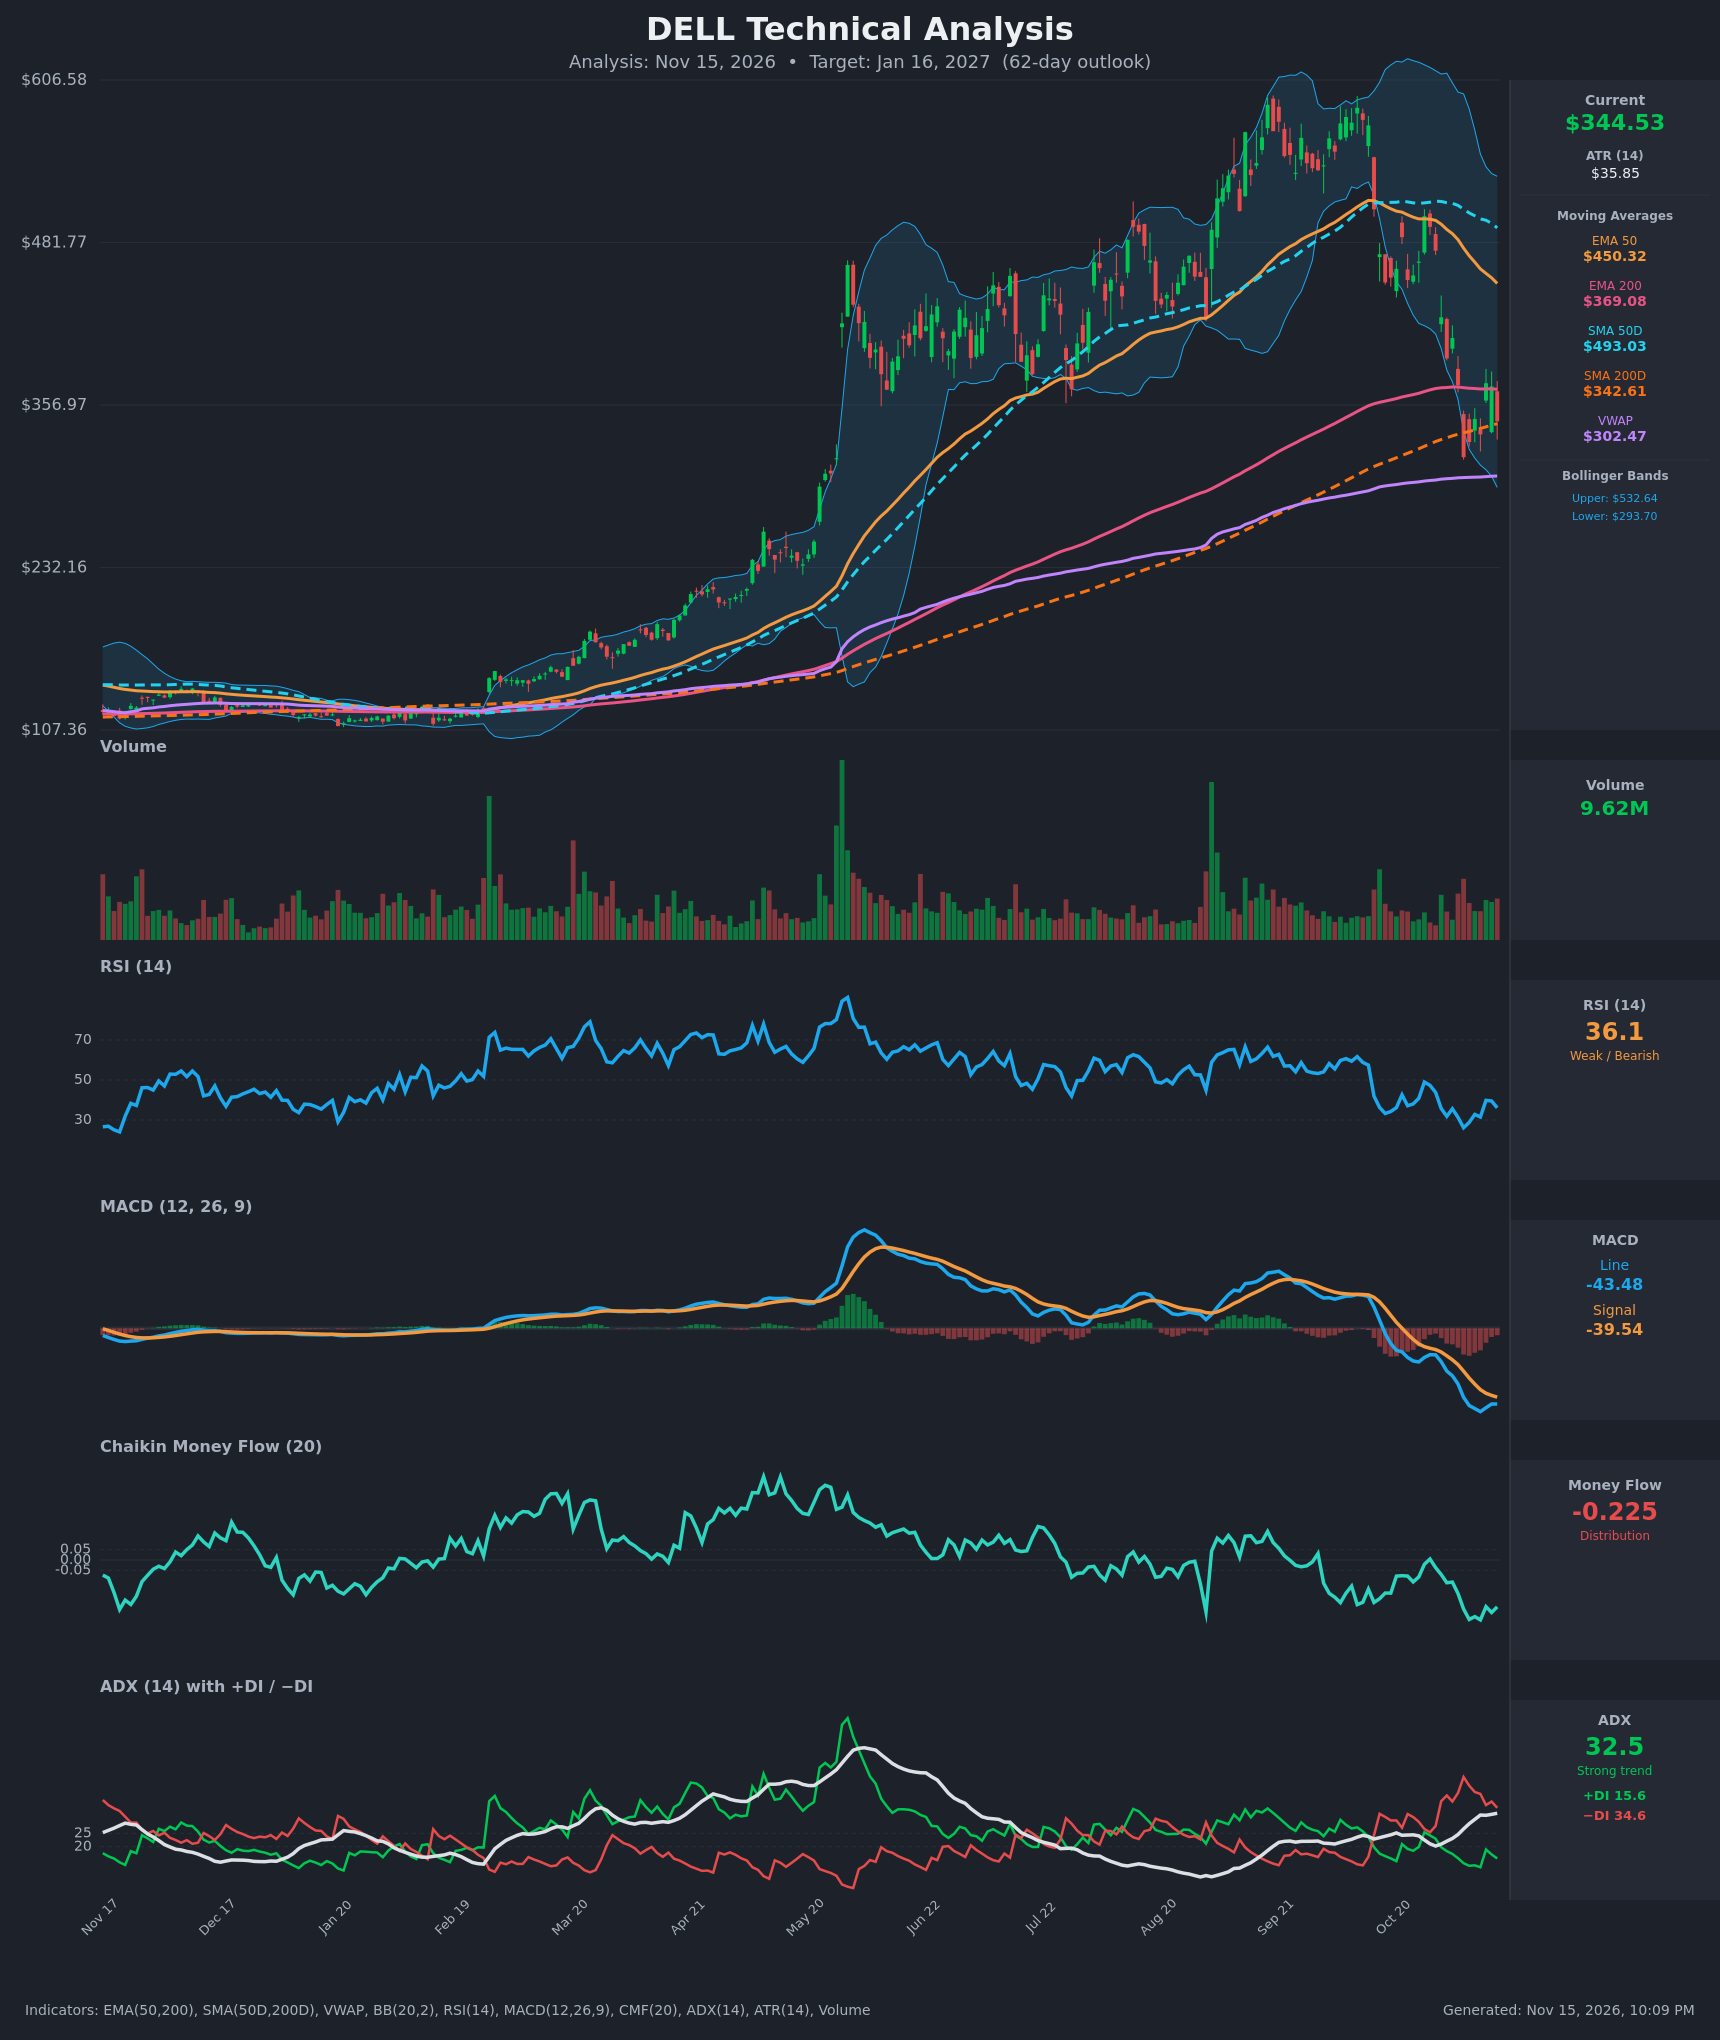
- RSI (14): 36.08, below 50 and near oversold. It hit a low of 26.1 on Nov 5, bounced to about 40, and has rolled over again. Momentum is weak, with no bullish divergence yet. [Bearish]
- 20 EMA: The 20 EMA isn't supplied. Price ($344.53) is below the EMA 50 ($450.32) by about 23%, and the EMA 50 is falling steeply, so it is overhead resistance. Price is also below the short-term averages implied by the Nov 11-12 bounce high of about $374. [Bearish]
- MACD: Line -43.48 is below signal -39.54, a bearish configuration since the late-October cross. The histogram is negative at about -3.9 and has narrowed slightly from the Nov 10 low, but the line is still sloping down and has not turned up. Momentum is at the weakest level of the year. [Bearish]
- Bollinger Bands (20): Upper $532.64, lower $293.70, so the bands are very wide after the big volatility expansion. Price sits in the lower third, below the midline (about $413), and after tagging the lower band on Nov 5 it has stayed in the lower part of the range. This is a downtrend with a bounce attempt rather than a squeeze. [Bearish]
- CMF (20): -0.225, well below -0.05, a sustained distribution reading. It made lower lows into November and has not turned up, so selling pressure is dominant. [Distribution]
- ADX (14): 32.5 and rising, with −DI (34.6) far above +DI (15.6). A strong downtrend is in force. +DI briefly bounced to 18.9 and then failed. [Strong Trend – Bearish]
- Volume: 9.62M, ordinary and without a capitulation spike. The Oct–Nov decline came on moderate-to-elevated volume, and the bounce attempts have had no notable volume expansion. A selling climax has not clearly occurred. [Neutral-to-Bearish]
Other key reads:
- SMA200D ($342.61) is almost exactly at current price, so price is testing long-term support.
- EMA 200 ($369.08) is just overhead and acts as resistance.
- VWAP ($302.47) is the next support below.
- SMA50D ($493.03) is far above price and falling.
- ATR is $35.85, about 10% of price, so volatility is very high.
- Death cross: EMA50 ($450) is above EMA200 ($369), so no EMA death cross yet. It could develop if the EMA 50 keeps sloping down toward $369. SMA50D is also well above SMA200D, so there is no death cross on the SMAs yet either, though the gap is closing quickly.
DIVERGENCES & TRENDS
- No bullish divergence. RSI's Nov 5 low of 26.1 was followed by a lower-high bounce to about 40 and a rollover to 36. MACD and CMF both make new lows alongside price.
- MACD has trended sharply downward from its October high, while the histogram is only mildly contracting. That could be the early stage of a base, but it is not confirmed.
- ADX has been rising since mid-October (about 20 to 32.5) while −DI dominates, which confirms a strengthening downtrend.
- The sequence of lower highs is intact: about $502 (Oct 27), $408 (Nov 3), $374 (Nov 11). Price keeps getting rejected at the declining EMA 200 (~$369) region.
- The EMA 50 and SMA50D are both rolling over and heading toward the longer averages, which signals a trend shift from the prior parabolic uptrend. The death cross risk is rising.
- Price is hugging SMA200D ($342.61). A decisive close below it would be a major technical break.
CHART PATTERNS
- Parabolic run followed by a broad top: The stock rose from about $110 to roughly $590. The top forms a rounded or head-and-shoulders-style distribution between August and October, and the sharp break below the $400-$430 support in late October acted as the neckline break. A measured move from that structure points toward the $300 area or lower.
- Bearish flag or pennant (small): The Nov 11-12 bounce to about $374 followed by the pullback to $344 is a minor lower-high bounce within a downtrend. A break below $316-$320 would target roughly $270-$290.
- Support test: Price sits at the SMA200D and the prior breakout zone. A hold could create a double-bottom-like base with the Nov 5 low at $316.91. That would need a break above about $374-$408 to confirm, and no such confirmation exists yet.
- The bearish reversal patterns on the reference diagram (head and shoulders, expanding triangle) best match the larger structure.
POTENTIAL SCENARIOS
- Scenario 1: Bearish Breakdown Below SMA200D and Nov Low — The strong downtrend (ADX 32.5, −DI dominant, CMF -0.225) continues. Price loses the SMA200D and the $317 low and slides toward the VWAP and the prior base. Trigger: daily close below $316. Target: $270-$300, with an extension to about $250. Invalidation: daily close above $375 with MACD turning up. (50% probability)
- Scenario 2: Neutral/Bullish Base and Relief Rally — Price holds the $317-$343 support zone (double-bottom-style), RSI is oversold, and the stock rallies back toward the EMA 200 and the declining moving averages. Trigger: close above $374 on rising volume. Target: $390-$420. Invalidation: close below $316. (30% probability)
- Scenario 3: Neutral Choppy Range — Price oscillates between $300 and $375 as it digests the decline around the SMA200D. Trigger: failure to break either $316 or $374. Target: $330-$350. Invalidation: close outside the $300-$375 range. (20% probability)
PRICE TARGETS
- Target Price: $318.00 (62-day target, Jan 16, 2027)
- Expected Range: $255.00 to $400.00 (width $145, about 42% of current price, which is wide given the very high volatility and ATR of about 10% of price; the guidance for 61-180 days is 18-30%, so this is intentionally somewhat wider, but I am tightening it below)
- Key Levels: Support at $316.91, Resistance at $373.68
Self-check, revised for the guideline: the 61-180 day band is 18-30% of price, so I narrow the range to $270.00 to $370.00 (width $100, about 29%). Final:
- Target Price: $318.00
- Expected Range: $270.00 to $370.00
- Key Levels: Support at $316.91, Resistance at $373.68
OVERALL BIAS
OVERALL BIAS: BEARISH - ADX is 32.5 with −DI far above +DI, MACD is below its signal and still making new lows, CMF at -0.225 shows persistent distribution, and price is making lower highs below the falling EMA 50 and the EMA 200 while it tests the SMA200D. A break of the $317 low would likely extend the move toward the $270-$300 area.
This is educational analysis and not financial advice.