DELL 34-day bearish forecast — Nov 15, 2026
- Bias: Bearish
- Timeframe: 34 days (made Nov 15, 2026, target date Dec 18, 2026)
- Price at analysis: $344.53
- Price target: $322.00
- Expected range: $295.00 – $350.00
- Result: Pending — graded after the close on Dec 18, 2026
Get a free AI analysis of DELL today
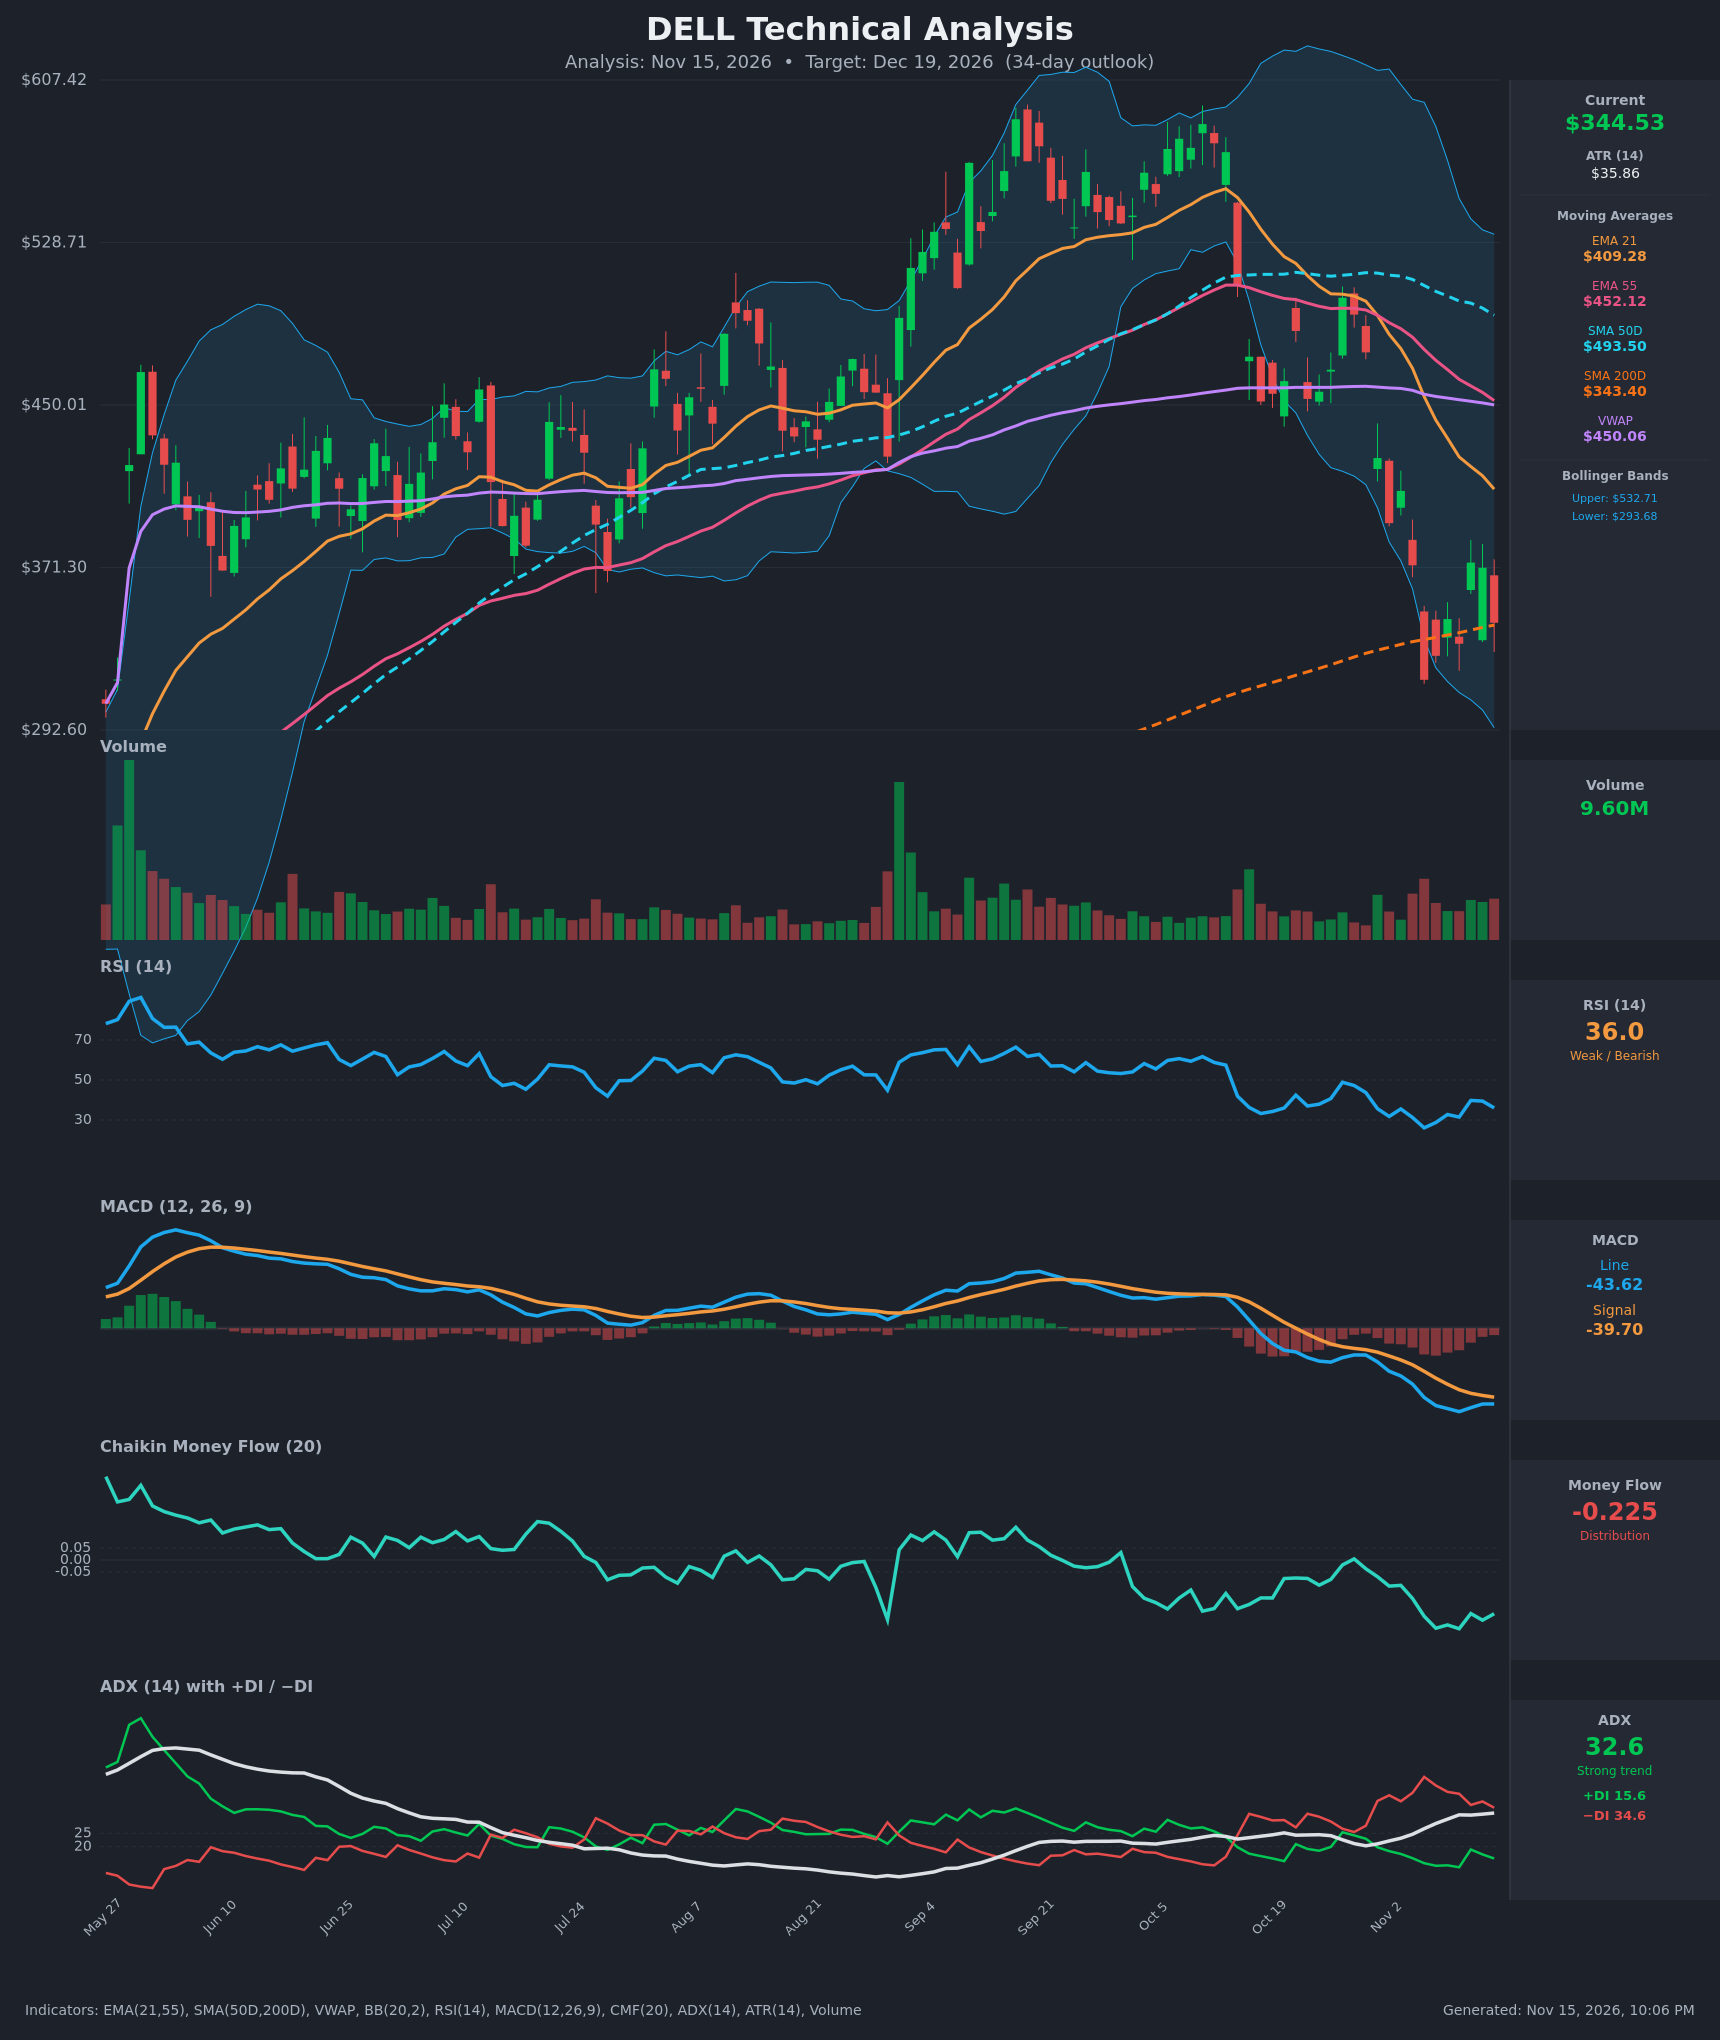
Analysis
TECHNICAL INDICATORS
- RSI (14): 36.04, below 50 and near the oversold zone but not yet under 30. It bottomed at 26.1 on Nov 5 and has bounced between 31 and 40 since, so downside momentum is stabilizing without a bullish turn. [Bearish]
- 20 EMA (EMA 21): $409.28, about 19% above price and falling steeply (from $503 on Oct 26). Price has stayed below it since Oct 30, so it acts as overhead resistance. EMA 21 also crossed below EMA 55 ($452.12) around Oct 30, a bearish crossover. [Bearish]
- MACD: Line -43.62 is below Signal -39.70, with a negative histogram of about -3.9. The line crossed below the signal in late October and has stayed under it. The histogram has narrowed from about -12.6 on Nov 10, which shows fading downside acceleration, but there is no bullish cross. [Bearish]
- Bollinger Bands (20): Upper $532.71, lower $293.68, so the midline is about $413. Price is in the lower third of very wide bands, about $51 above the lower band, after the Nov 5 close at $316.91 pierced the lower region. The bands are expanding from the earlier decline, which fits a trending move. A "walk the band" decline is still possible, though a reversion bounce is plausible. [Bearish]
- CMF (20): -0.225, well below -0.05 and near the cycle low. Distribution has persisted for weeks and no accumulation has appeared on the bounce attempts. [Distribution]
- ADX (14): 32.6 and rising from about 20 in late October. −DI (34.6) is far above +DI (15.6), and the DI spread widened again on Nov 13. This is a strong, established downtrend. [Strong Trend – Bearish]
- Volume: 9.60M, roughly average. The heavy volume came on the Oct 30–Nov 5 selloff. The bounce candles on Nov 11–12 had no standout volume, so there was no conviction buying. [Neutral-to-Bearish: no accumulation on the bounce]
Other moving averages and levels:
- SMA 200D: $343.40, and price ($344.53) sits right on it. This is the key long-term support test.
- SMA 50D: $493.50, far above price.
- VWAP: $450.06, also far above price. Price is well below VWAP, which signals sellers in control.
DIVERGENCES & TRENDS
- Trend: The structure shows clear lower highs: roughly $600 (Sep/Oct), then $501.96 (Oct 27), then $408.40 (Nov 3), then $373.68 (Nov 11). Price is also making lower lows, from $316.91 on Nov 5 to a fresh push down on Nov 13 ($344.53, down 7.8% on the day).
- Possible bullish divergence in momentum: The MACD histogram is shrinking, and RSI made a higher low (31.5 on Nov 10 versus 26.1 on Nov 5). However, price on Nov 10 ($334.38) was only modestly above the Nov 5 low, and Nov 13's RSI of 36.0 was rejected from 39.8. This is a weak, unconfirmed signal.
- Crossovers:
- EMA21 is below EMA55, a bearish crossover.
- MACD is below its signal, bearish.
- −DI is above +DI, bearish.
- There is no death cross yet. SMA50D ($493.50) is still far above SMA200D ($343.40), but the gap is closing fast as SMA50D rolls over.
- Price vs SMA200D: Price is sitting right on the long-term trend line, so a decisive close below would shift the long-term trend from uptrend to downtrend.
- CMF: It has trended steadily lower for months with no bullish divergence, confirming persistent selling.
CHART PATTERNS
- Bearish Flag / Pennant (continuation): After the sharp Oct 30–Nov 5 drop (the flagpole), price rebounded to $373.68 and rolled over. This is a tentative flag in which the Nov 13 reversal rejected the upper boundary. A confirmed breakdown targets the flagpole measured move, which would be well below the $293 lower Bollinger Band. I would not rely on the full measure in 34 days.
- Lower-high descending structure: The trend is similar to a descending channel or descending triangle bias. The horizontal support is around $317–$334, the Nov 5 and Nov 10 lows, and the lower highs press into it. A break below $317 would be bearish confirmation, with a first target near $290.
- Possible double bottom (bullish reversal): This is weak at best. The lows at $316.91 and $334.38 are not equal, and the bounce failed under $374. It needs a close above $374 to gain credibility.
- Falling wedge-like decline (bullish reversal): The move down from the peak could be read as a falling wedge, but the expanding ADX and −DI dominance argue against trusting it yet.
POTENTIAL SCENARIOS
- Scenario 1: Bearish Breakdown Below SMA200D — Price loses the $343 SMA200D and the $317 swing low as distribution continues (CMF -0.225, −DI 34.6). Sellers push toward the lower Bollinger Band and the bear flag measured move. Trigger: daily close below $340, then below $316.91. Target: $320 in the base case, with an extension to $293–$300. Invalidation: daily close above $374 (the Nov 11 high). (50% probability)
- Scenario 2: Bullish Oversold Bounce Off SMA200D — The SMA200D holds, RSI turns up from the low 30s, and the narrowing MACD histogram leads to a relief rally. Trigger: close above $374 with improving volume and CMF. Target: $400–$410 (the EMA21 and prior breakdown zone). Invalidation: close below $316.91. (28% probability)
- Scenario 3: Neutral Range Consolidation — Price chops between the Nov 5 low and the Nov 11 high for several weeks as ADX flattens. Trigger: failed breakdown and bounce attempts holding between support and resistance. Target: $320–$370 range. Invalidation: close outside either end. (22% probability)
PRICE TARGETS
Range check: width = $350.00 − $295.00 = $55.00, which is 16.0% of the $344.53 current price. That sits within the 12–18% guidance for 30–60 days.
- Target Price: $322.00 (for the 34-day timeframe, about 6.5% below current price)
- Expected Range: $295.00 to $350.00
- Key Levels: Support at $316.91, Resistance at $373.68
OVERALL BIAS
OVERALL BIAS: BEARISH - ADX at 32.6 with −DI far above +DI, a bearish MACD, deeply negative CMF (-0.225), price below every key average except SMA200D, and lower highs all point to continued downside. The first test is the $343 SMA200D and the $317 swing low, and the narrowing MACD histogram keeps a bounce possible, which is why the target is modest.
This is educational analysis and not financial advice.