DELL 83-day bearish forecast — Nov 15, 2026
- Bias: Bearish
- Timeframe: 83 days (made Nov 15, 2026, target date Feb 5, 2027)
- Price at analysis: $344.53
- Price target: $310.00
- Expected range: $260.00 – $360.00
- Result: Pending — graded after the close on Feb 5, 2027
Get a free AI analysis of DELL today
Analysis
TECHNICAL INDICATORS
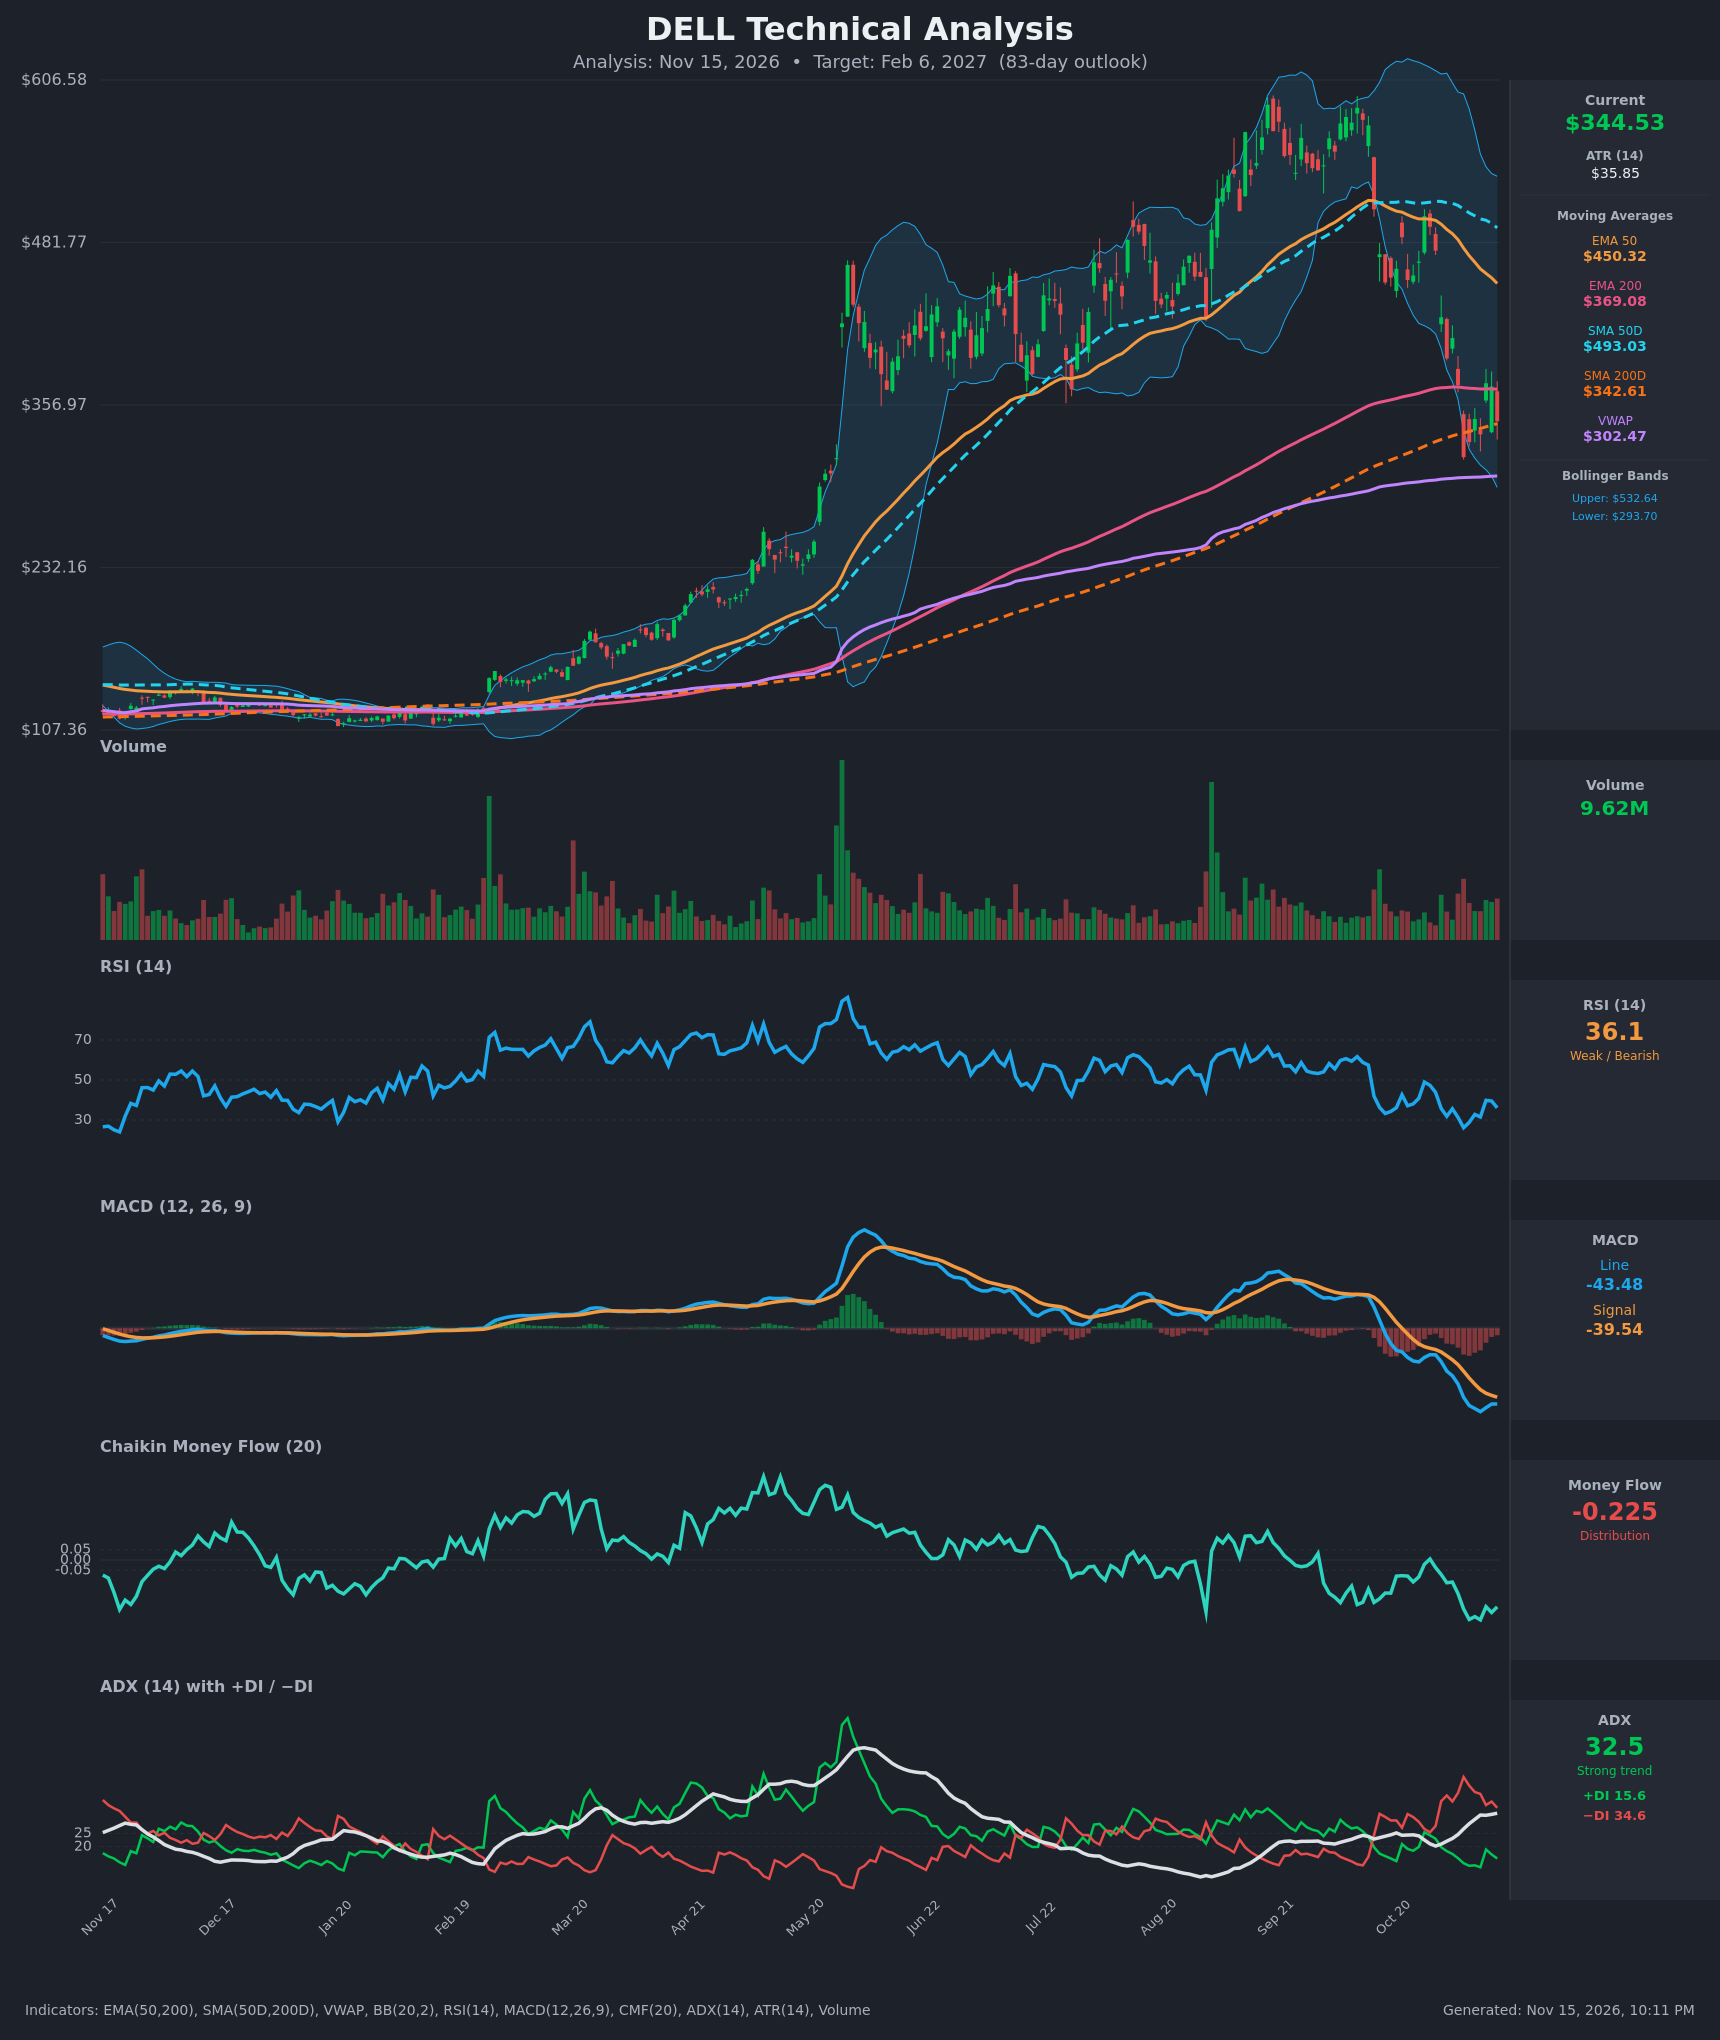
- RSI (14): 36.08, recovering from an oversold low of 26.1 on Nov 5 but still below 40 and failing to reclaim 50. Lower highs in the bounce (39.8, then 39.5, then 36.1) show momentum is still weak. [Bearish]
- 20 EMA: The 20 EMA is not provided. Price at $344.53 is far below the EMA 50 ($450.32) and the EMA 200 ($369.08), which act as overhead resistance. Price is slightly above the SMA200D ($342.61), which is the nearest support. [Bearish]
- MACD: Line -43.48 is below Signal -39.54, a bearish crossover that is still in force. The histogram is negative at about -3.9, and the gap has narrowed slightly from the Nov 10 extreme. The line is deeply negative, so momentum is bearish but starting to stabilize. [Bearish]
- Bollinger Bands (20): Price is $344.53, between the lower band ($293.70) and the midline (about $413). Bands are very wide (upper $532.64), which reflects the high volatility of the recent crash. Price bounced off the lower band, but it sits in the lower half of the range. [Bearish]
- CMF (20): -0.225, well below -0.05. It has been negative for weeks and fell to -0.288, which indicates persistent distribution. [Distribution]
- ADX (14): 32.5 and rising, so the trend is strong. −DI at 34.6 is well above +DI at 15.6, so sellers are in control of the downtrend. [Strong Trend – Bearish]
- Volume: 9.62M, moderate and below the spikes seen at prior highs. Heavy selling came on the breakdown candles from Oct 30 to Nov 5. The bounce candles carry no convincing volume expansion. [Neutral to Bearish]
DIVERGENCES & TRENDS
- Price and RSI: Price made a lower low on Nov 5 ($316.91), and RSI made its low at 26.1. The retest on Nov 10 ($334) came with RSI at 31.5, a higher low. This is a mild bullish divergence, but it is not confirmed.
- Moving average structure: The EMA50 is above the EMA200, and the SMA50D ($493) is far above the SMA200D ($342.6). There is no death cross yet, but the gaps are closing quickly. The EMA50 ($450) is falling toward the EMA200 ($369), so a bearish EMA cross is plausible within weeks.
- Price vs. SMA200D: Price is hovering right at the SMA200D ($342.61), which is the last major long-term support. The SMA200D itself is still rising.
- MACD: The bearish cross happened in late October and the line keeps making new lows, though the pace of decline is slowing.
- CMF and ADX: CMF is persistently negative. ADX is climbing with −DI dominant, which confirms the downtrend. There was a brief +DI uptick on Nov 11 that faded.
- VWAP: Price at $344.53 is above VWAP ($302.47), which is a supportive factor but secondary to the broader damage.
CHART PATTERNS
- Bearish rising wedge / topping structure: The 2026 rally peaked near $570–600 in Sep and Oct with a rounded top. Price has broken down hard through the EMA50 and SMA50D. This resembles a bearish reversal (head-and-shoulders or expanding-triangle style distribution). The measured move points to a retracement of a large part of the advance.
- Bear flag potential: The bounce from $317 to $373 and back to $344 looks like a small corrective flag or pennant after a steep drop. A break below $317 would project further downside, toward $270–280.
- Key confluence: The SMA200D (about $342.6) and the Nov 5 low ($317) are the critical supports. The lower Bollinger Band ($293.70) is the next level down.
POTENTIAL SCENARIOS
- Scenario 1: Bearish Continuation Below the 200-Day — The strong downtrend (ADX 32.5, −DI dominant), distribution (CMF -0.225), and bearish MACD resolve with price losing the SMA200D and the $317 low. A death cross forms later in the window. Trigger: daily close below $317. Target: $270–$285, with extension to about $250. Invalidation: close above $373, then $400. (50% probability)
- Scenario 2: Bullish Relief Bounce / Base — Oversold conditions, the RSI higher low, and support at the SMA200D produce a rebound toward the falling EMA200 and the prior breakdown area. Trigger: close above $373 on rising volume. Target: $390–$420. Invalidation: close below $317. (30% probability)
- Scenario 3: Neutral Range Between the 200-Day and the EMA200 — Price chops between $300 and $375 as the market digests the crash. Trigger: failure to break either $317 or $373. Target: $330–$350. Invalidation: decisive break beyond either boundary. (20% probability)
PRICE TARGETS
Over 83 days, ATR-based volatility is high (about $36 per day). The range width should be around 18–30% of price, so I use roughly 28%.
- Target Price: $310.00 (for the 83-day timeframe, Feb 6, 2027)
- Expected Range: $260.00 to $360.00 (width $100, about 29% of the current price)
- Key Levels: Support at $317.00, Resistance at $373.00
OVERALL BIAS
OVERALL BIAS: BEARISH - Price is in a strong, confirmed downtrend (ADX 32.5 with −DI at 34.6 versus +DI at 15.6), CMF shows heavy distribution, MACD is bearish, and the EMA50 and SMA50D are collapsing toward the long-term averages. The SMA200D is being tested and the $317 low is likely to be retested, though oversold conditions could produce bounces on the way.
This is educational analysis and not financial advice.