IBM 4-day bullish forecast — Oct 31, 2026
- Bias: Bullish
- Timeframe: 4 days (made Oct 31, 2026, target date Nov 3, 2026)
- Price at analysis: $257.86
- Price target: $259.50
- Expected range: $254.30 – $262.30
- Result: Incorrect (-3.2%) — closed at $249.50 on Nov 3, 2026; quality score 17/100
Get a free AI analysis of IBM today
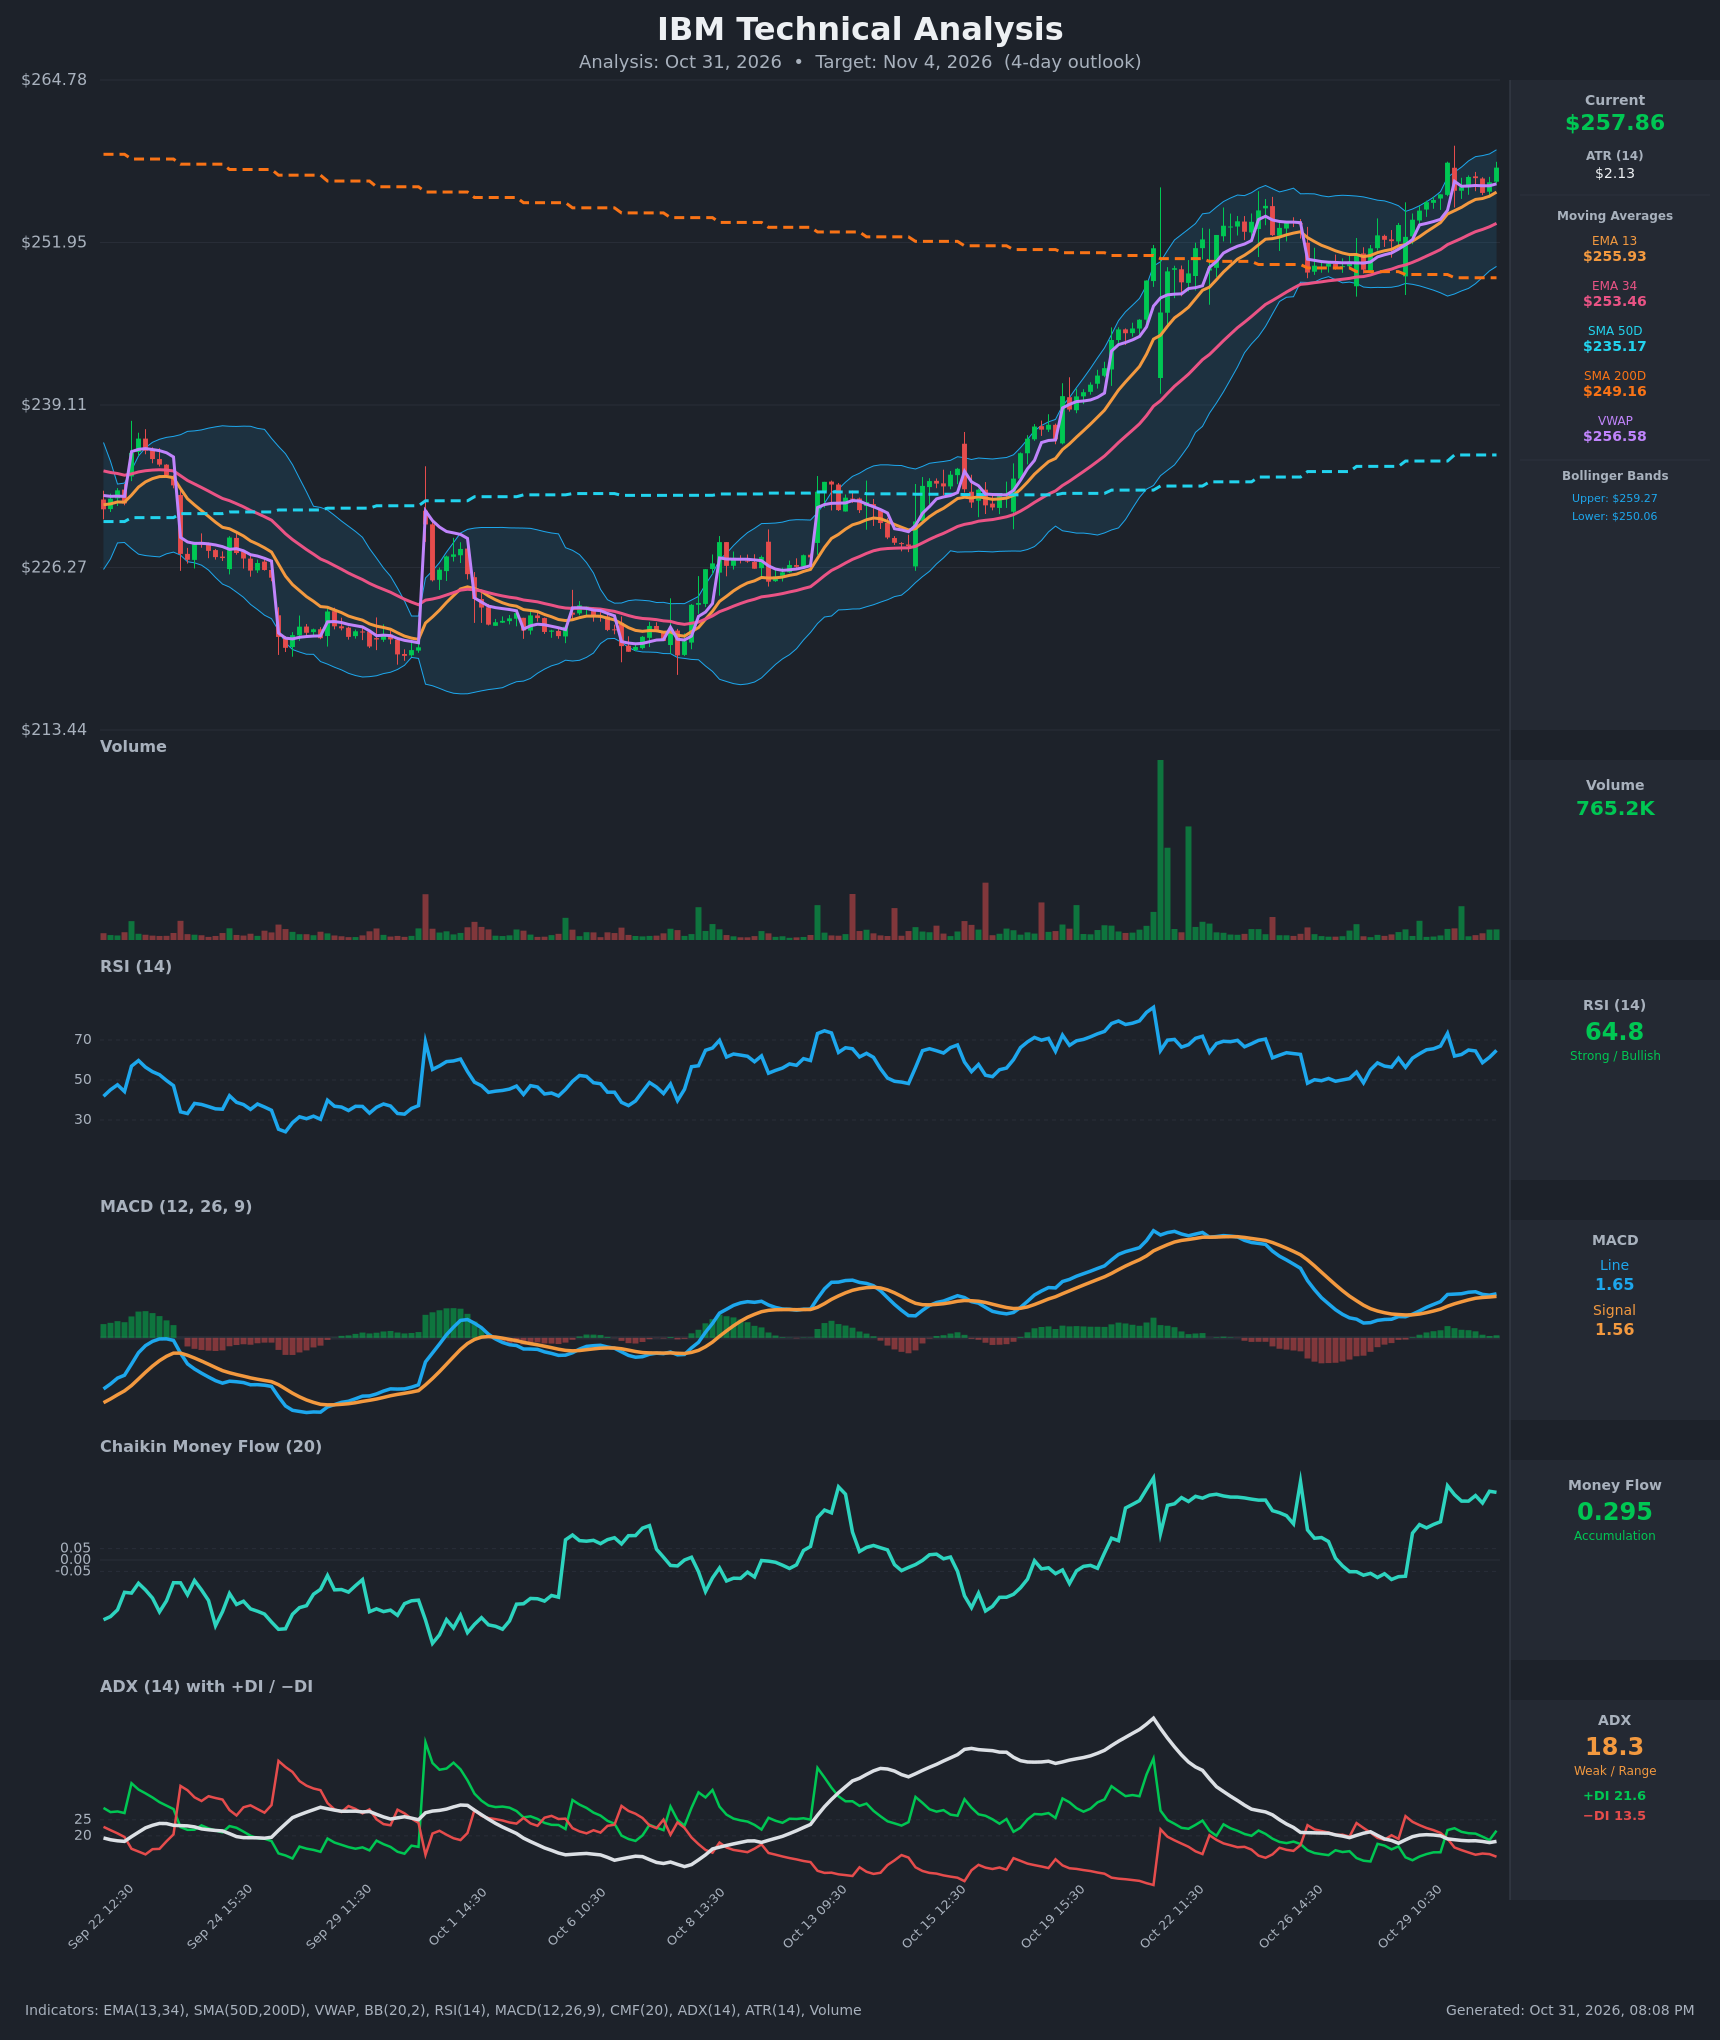
Analysis
TECHNICAL INDICATORS
- RSI (14): 64.82, up from 58.7 on Oct 30 13:30 but below the 73.3 overbought peak on Oct 29 15:30. It is in the strong-momentum zone and not yet overbought. Momentum is firm and recovering. [Bullish]
- 20 EMA: The chart supplies EMA 13 ($255.93) and EMA 34 ($253.46). Price at $257.86 is above both, and EMA13 is above EMA34 with a widening gap, which is a stacked bullish structure. The EMA13 is the first support at about $255.9. [Bullish]
- MACD: Line 1.655 is above signal 1.558, a positive histogram of about +0.10. The line crossed back above the signal on Oct 29 and is making a new local high. The histogram is thin, so momentum is positive but not accelerating. [Bullish]
- Bollinger Bands (20): Upper $259.27, lower $250.06, mid about $254.67. Price sits in the upper third, about $1.4 below the upper band. The bands are narrowing slightly after the earlier expansion, which suggests a pause or grind higher and not an explosive breakout. Price is riding the upper half, but room remains before a band tag. [Bullish]
- CMF (20): 0.295 is well above +0.05, and has been consistently positive since Oct 29 10:30. This signals strong accumulation and buying pressure. [Accumulation]
- ADX (14): 18.3, which is weak or range-bound and has been drifting down from the peak of the earlier trend. +DI 21.6 is above −DI 13.5, so bulls are in control, but the trend lacks strength. [Weak Trend, Bullish Direction]
- Volume: 765.2K, which is modest and below the large spike during the Oct 21–22 breakout. Recent up-bars show steady, unspectacular participation. There is no capitulation or climactic buying. [Neutral to mildly supportive]
DIVERGENCES & TRENDS
- No clear bearish RSI divergence: price made a new high around $258 and RSI is at 64.8 versus 73.3 at the prior peak. This is a mild lower-high in RSI relative to the price high, which is a small caution flag, not a confirmed divergence.
- MACD is rising again after a bearish pullback in the histogram (Oct 22–27), and the line is back above the signal.
- The EMA13 is above EMA34, and both are above the SMA200D ($249.16). SMA50D ($235.17) is below SMA200D, so a golden cross has not occurred, but the 50D is rising steadily and closing the gap. Price is well above both, so the long-term bias has shifted to uptrend.
- Price is above VWAP ($256.58), confirming buyers are in control intraday.
- ADX has fallen from a peak to 18.3 while price consolidated near highs. This means the trend is pausing and not reversing.
CHART PATTERNS
- The price pattern resembles a Bullish Flag / consolidation after the strong Oct 13–22 rally, followed by a sideways base around $250–$256 and a fresh breakout to $258. This is a continuation structure.
- The ascending base of higher lows (about $252 to $255) under resistance near $258 loosely resembles an Ascending Triangle. A decisive break above $258.25 targets roughly $260–$262, based on the measured move of the consolidation range (about $5–6).
- There is no confirmed reversal pattern such as a double top. The $258.25 high from Oct 29 and the current $257.86 reading could form a minor double-top test, so a failure here would risk a pullback to the EMA13/VWAP area.
POTENTIAL SCENARIOS
- Scenario 1: Bullish Breakout Continuation — Price breaks above the $258.25 resistance and rides the upper Bollinger Band, supported by strong CMF and positive MACD. Trigger: hourly close above $258.30 with rising volume. Target: $261.00–$262.00. Invalidation: close below $255.90 (EMA13). (50% probability)
- Scenario 2: Neutral Range Consolidation — Weak ADX keeps price pinned between the EMA13/VWAP area and the upper band. Trigger: failure to clear $258.30 with overlapping candles. Target: $256.00–$259.00. Invalidation: break above $259.30 or below $254.50. (28% probability)
- Scenario 3: Bearish Pullback — Minor double-top at $258 and a lower RSI high trigger profit-taking toward the mid-band. Trigger: close below $255.90 and VWAP at $256.58, with MACD histogram turning negative. Target: $253.50–$254.70. Invalidation: reclaim of $258.30. (22% probability)
PRICE TARGETS
- Target Price: $259.50 (4-day horizon)
- Expected Range: $254.30 to $262.30 (width $8.00, about 3.1% of the current price, appropriate for a short 4-day window)
- Key Levels: Support at $255.93 (EMA13), then $253.46 (EMA34); Resistance at $259.27 (upper Bollinger Band), then $262.00
OVERALL BIAS
OVERALL BIAS: BULLISH - Price is above all key moving averages and VWAP, CMF shows strong accumulation (0.295), MACD is positive, and +DI leads −DI. The weak ADX of 18.3 limits upside conviction, so expect a modest grind higher toward $259–$260.
This is educational analysis and not financial advice.