IBM 83-day bullish forecast — Nov 15, 2026
- Bias: Bullish
- Timeframe: 83 days (made Nov 15, 2026, target date Feb 5, 2027)
- Price at analysis: $247.13
- Price target: $259.00
- Expected range: $224.00 – $278.00
- Result: Pending — graded after the close on Feb 5, 2027
Get a free AI analysis of IBM today
Analysis
TECHNICAL INDICATORS
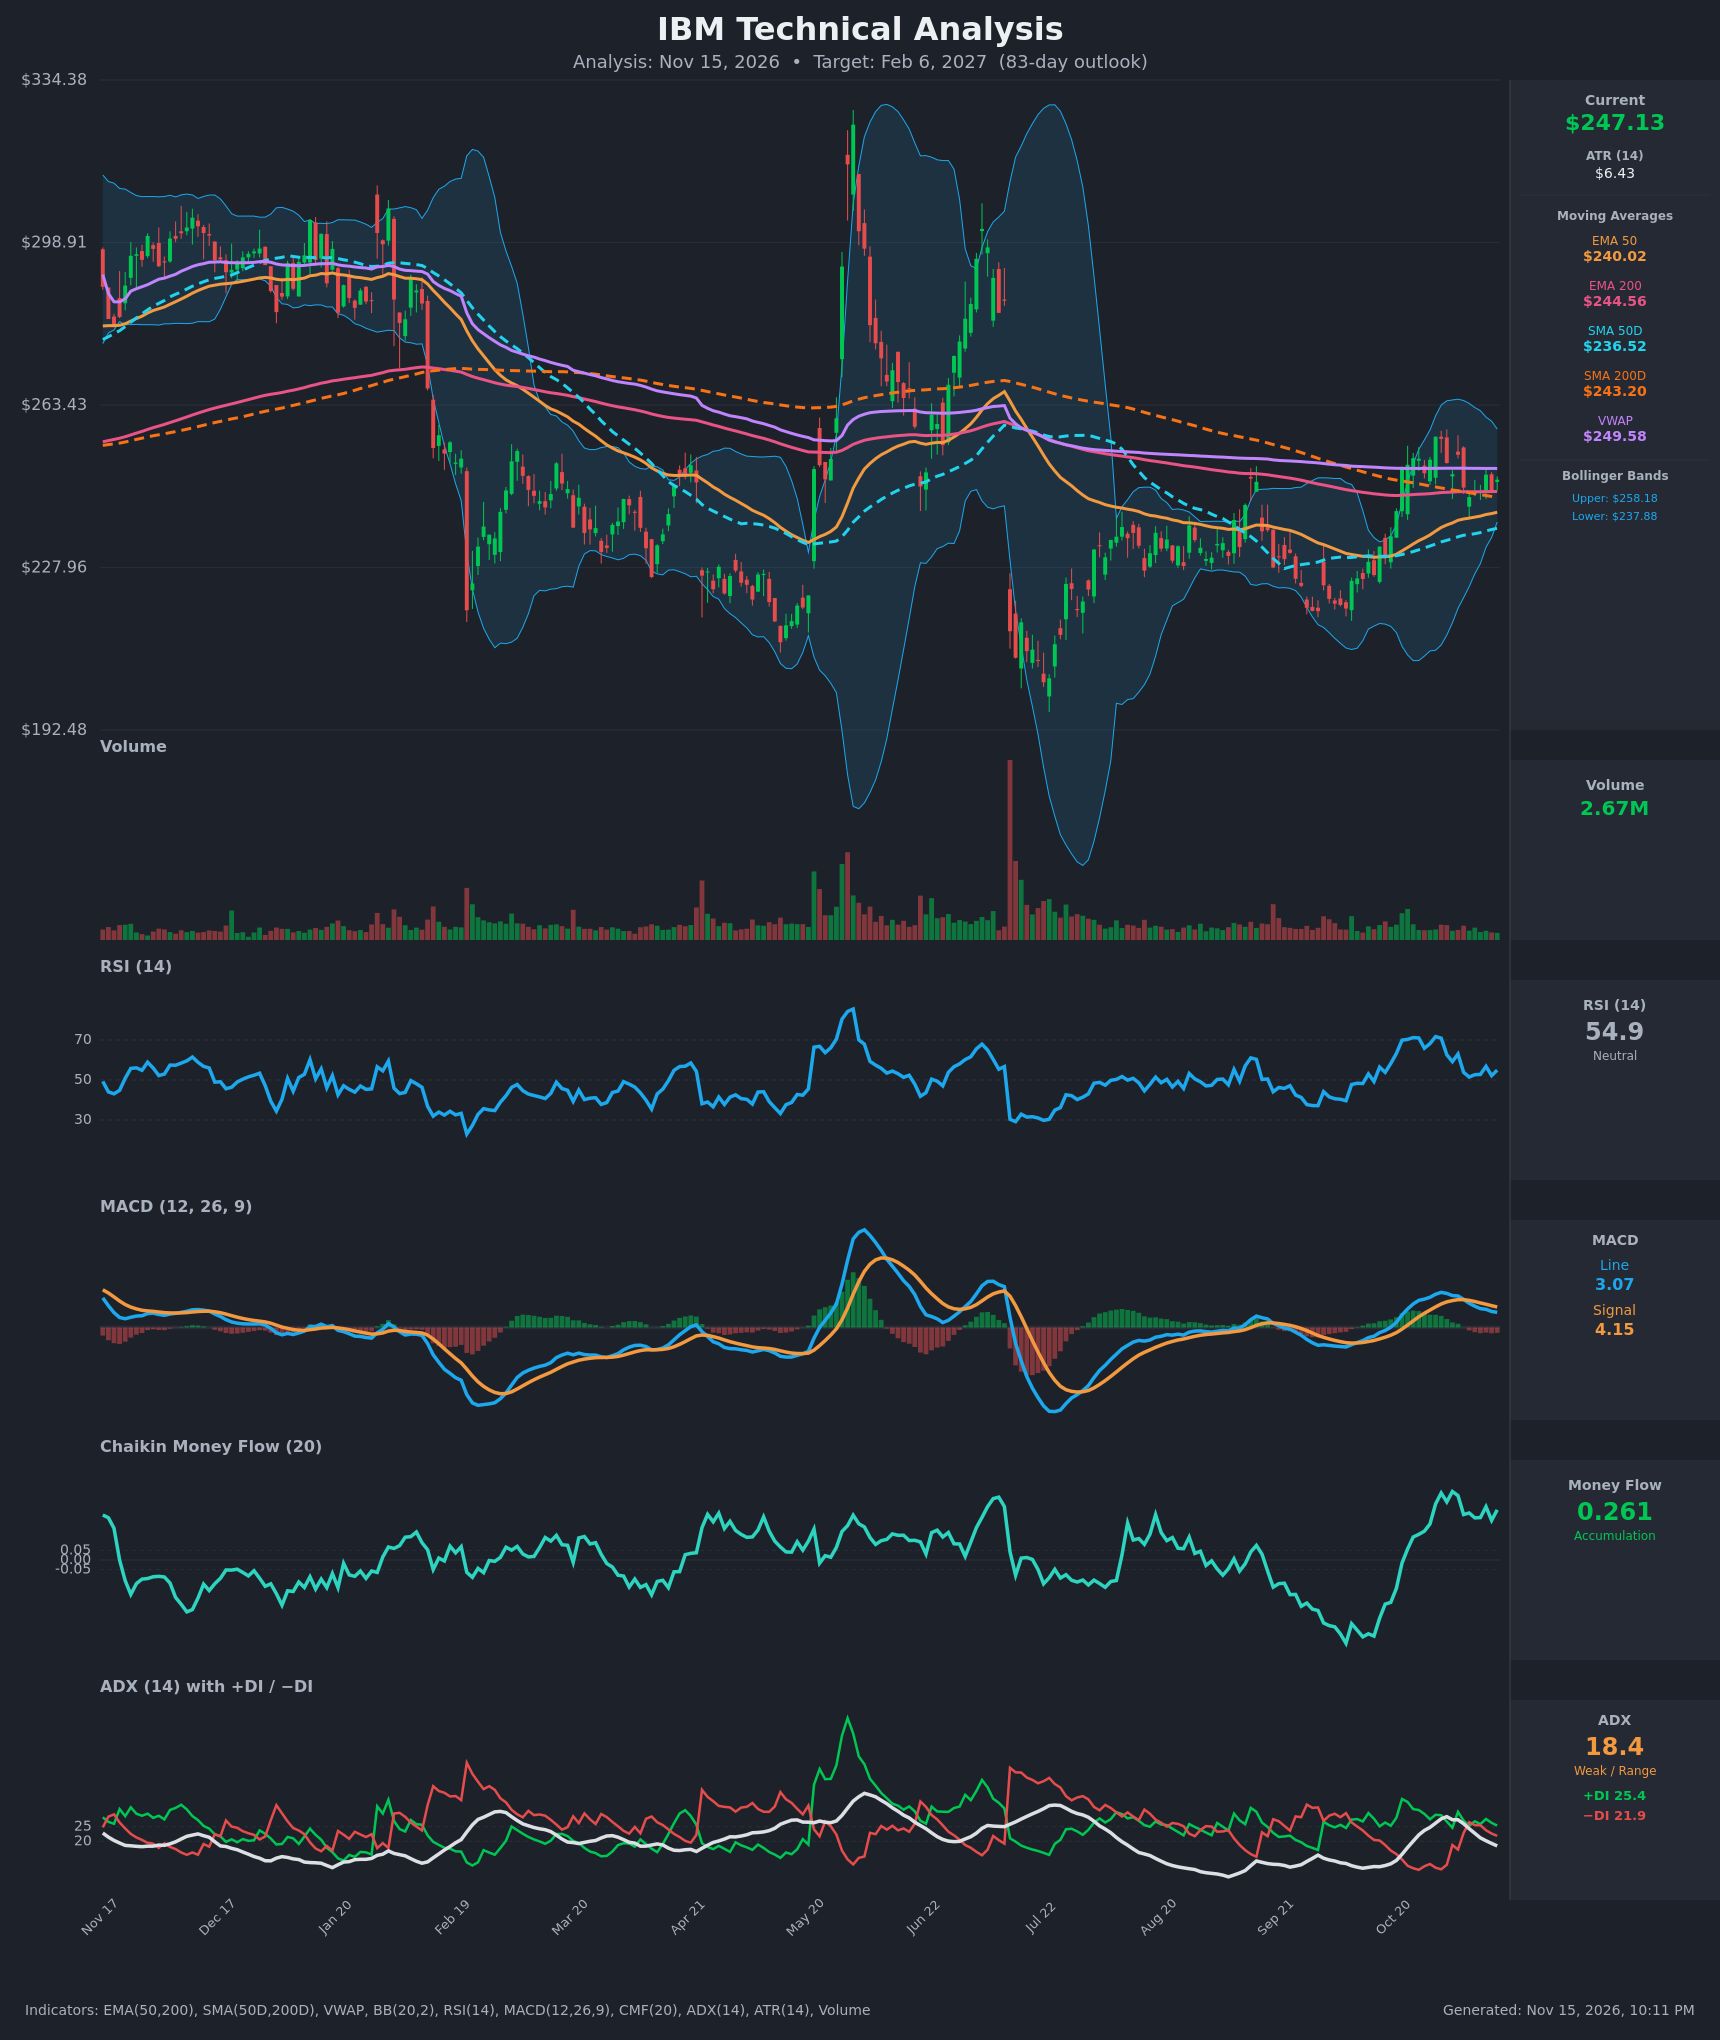
- RSI (14): 54.93, back near the midline after peaking around 71 in late October. Momentum has cooled from overbought and is stabilizing at 52-57 over the last week, with no strong directional signal. [Neutral]
- 20 EMA: Not provided directly. The EMA 50 is $240.02 and price ($247.13) is above it, so it acts as support. The EMA 50 has risen steadily from $233.82 in 15 bars. Price is also just above the EMA 200 ($244.56), which has been resistance for most of the year. [Bullish]
- MACD: Line 3.07 is below signal 4.15, a bearish crossover that occurred around Nov 5. Both lines are still positive but falling, and the histogram is negative (about -1.08). Short-term momentum is fading. [Bearish]
- Bollinger Bands (20): Upper $258.18, lower $237.88, middle about $248. Price is near the midline, and the bands have narrowed from the prior expansion, which points to consolidation. Price is neither stretched nor compressed against either band. [Neutral]
- CMF (20): 0.261, well above +0.05. It has been positive for the entire 15-bar window (0.13 to 0.36) and has risen from deeply negative levels in September. Buyers are persistently accumulating even during the pullback. [Accumulation]
- ADX (14): 18.4 and falling from 28.4. +DI (25.4) is slightly above −DI (21.9), but the spread is narrow. Trend strength is weak and the market is range-bound, with a slight bullish edge. [Weak Trend, slightly bullish]
- Volume: 2.67M, light and below the spikes seen on the earlier breakdown and breakout days. Recent pullback bars are on quiet volume, which is non-threatening, but the lack of expansion means there is no breakout confirmation yet. [Neutral / low conviction]
DIVERGENCES & TRENDS
- MACD vs. CMF: The MACD has crossed bearish and its histogram is negative, while CMF stays strongly positive. Momentum is cooling but money flow still favors buyers, which is typical of a healthy consolidation after a rally.
- Moving-average structure: SMA 50 ($236.52) is below SMA 200 ($243.20), so there is no golden cross yet. The gap has narrowed from about $14 to about $6.7. The EMA 50 ($240.02) is also closing on the EMA 200 ($244.56). A golden cross within the 83-day window is plausible if price holds current levels.
- Price vs. long-term averages: Price is above the SMA 200 and EMA 200, but only by about $2.5-4. This is a fresh reclaim of the long-term averages, not yet a proven trend change.
- VWAP: Price is below VWAP ($249.58), which has capped rallies. A close above it would be constructive.
- ADX: It has dropped from 28.4 to 18.4 as the October rally stalled. The DI lines have crossed back and forth in the past week, showing indecision.
- Higher lows: The September low (~$220) was followed by a higher low near $243 in early November, a modestly constructive sequence.
CHART PATTERNS
- Base after the long decline: Price has moved sideways to higher from the September low (about $220) to a range of about $243-$256. This resembles a Bullish Flag / Pennant-style consolidation after the October thrust. The pullback has a mild downward slope, with RSI cooling and volume drying up.
- Resistance zone: The $256-$258 area is the top of the range, where the October highs and the upper Bollinger Band coincide. A breakout above it would project a measured move of roughly $10-$12 (the pole from ~$225 to ~$256), toward $268-$270.
- Larger context: The chart shows a broad descending structure since the early-year highs near $300+. The $263-$270 zone, near the prior SMA 200 and a major supply area, is the next major hurdle. It limits upside without a very strong catalyst.
- Bear case: If price loses $237-$240, the pattern would become a failed flag, pointing to $225-$220.
POTENTIAL SCENARIOS
- Scenario 1: Bullish Range Breakout and Golden Cross Attempt — Price holds above the EMA 50 and the 200-day averages, then breaks above the October highs as accumulation continues and the SMA 50 approaches the SMA 200. Trigger: daily close above $258 on rising volume. Target: $259-$270 (measured move), with a stretch toward $275. Invalidation: daily close below $237. (50% probability)
- Scenario 2: Neutral Extended Consolidation — Weak ADX keeps IBM pinned between the 50-day averages and the upper band, oscillating around the 200-day averages. Trigger: repeated failures at $256-$258 and holds at $238-$240. Target: $240-$255 range. Invalidation: close outside $236-$260. (25% probability)
- Scenario 3: Bearish Failed Reclaim — The bearish MACD crossover extends, price slips back below the 200-day averages and the longer-term downtrend resumes. Trigger: daily close below $237.88 (lower band) and the SMA 50. Target: $225-$220. Invalidation: reclaim of $250 (above VWAP) on strong volume. (25% probability)
PRICE TARGETS
- Target Price: $259.00 (83-day, Feb 6, 2027)
- Expected Range: $224.00 to $278.00 (width $54, about 21.8% of current price, consistent with the 61-180 day guidance)
- Key Levels: Support at $240.02 (EMA 50, with the lower Bollinger Band at $237.88 below it), Resistance at $258.18 (upper Bollinger Band, near the October highs)
OVERALL BIAS
OVERALL BIAS: BULLISH - Price has reclaimed the 200-day averages and sits above the rising EMA 50 and SMA 50, with CMF showing strong sustained accumulation (0.26) and higher lows since September. This outweighs the cooling MACD and weak ADX, though upside is likely capped near the $263-$270 supply zone.
This is educational analysis and not financial advice.