IBM 20-day bullish forecast — Nov 15, 2026
- Bias: Bullish
- Timeframe: 20 days (made Nov 15, 2026, target date Dec 4, 2026)
- Price at analysis: $247.13
- Price target: $252.50
- Expected range: $236.50 – $262.00
- Result: Pending — graded after the close on Dec 4, 2026
Get a free AI analysis of IBM today
Analysis
TECHNICAL INDICATORS
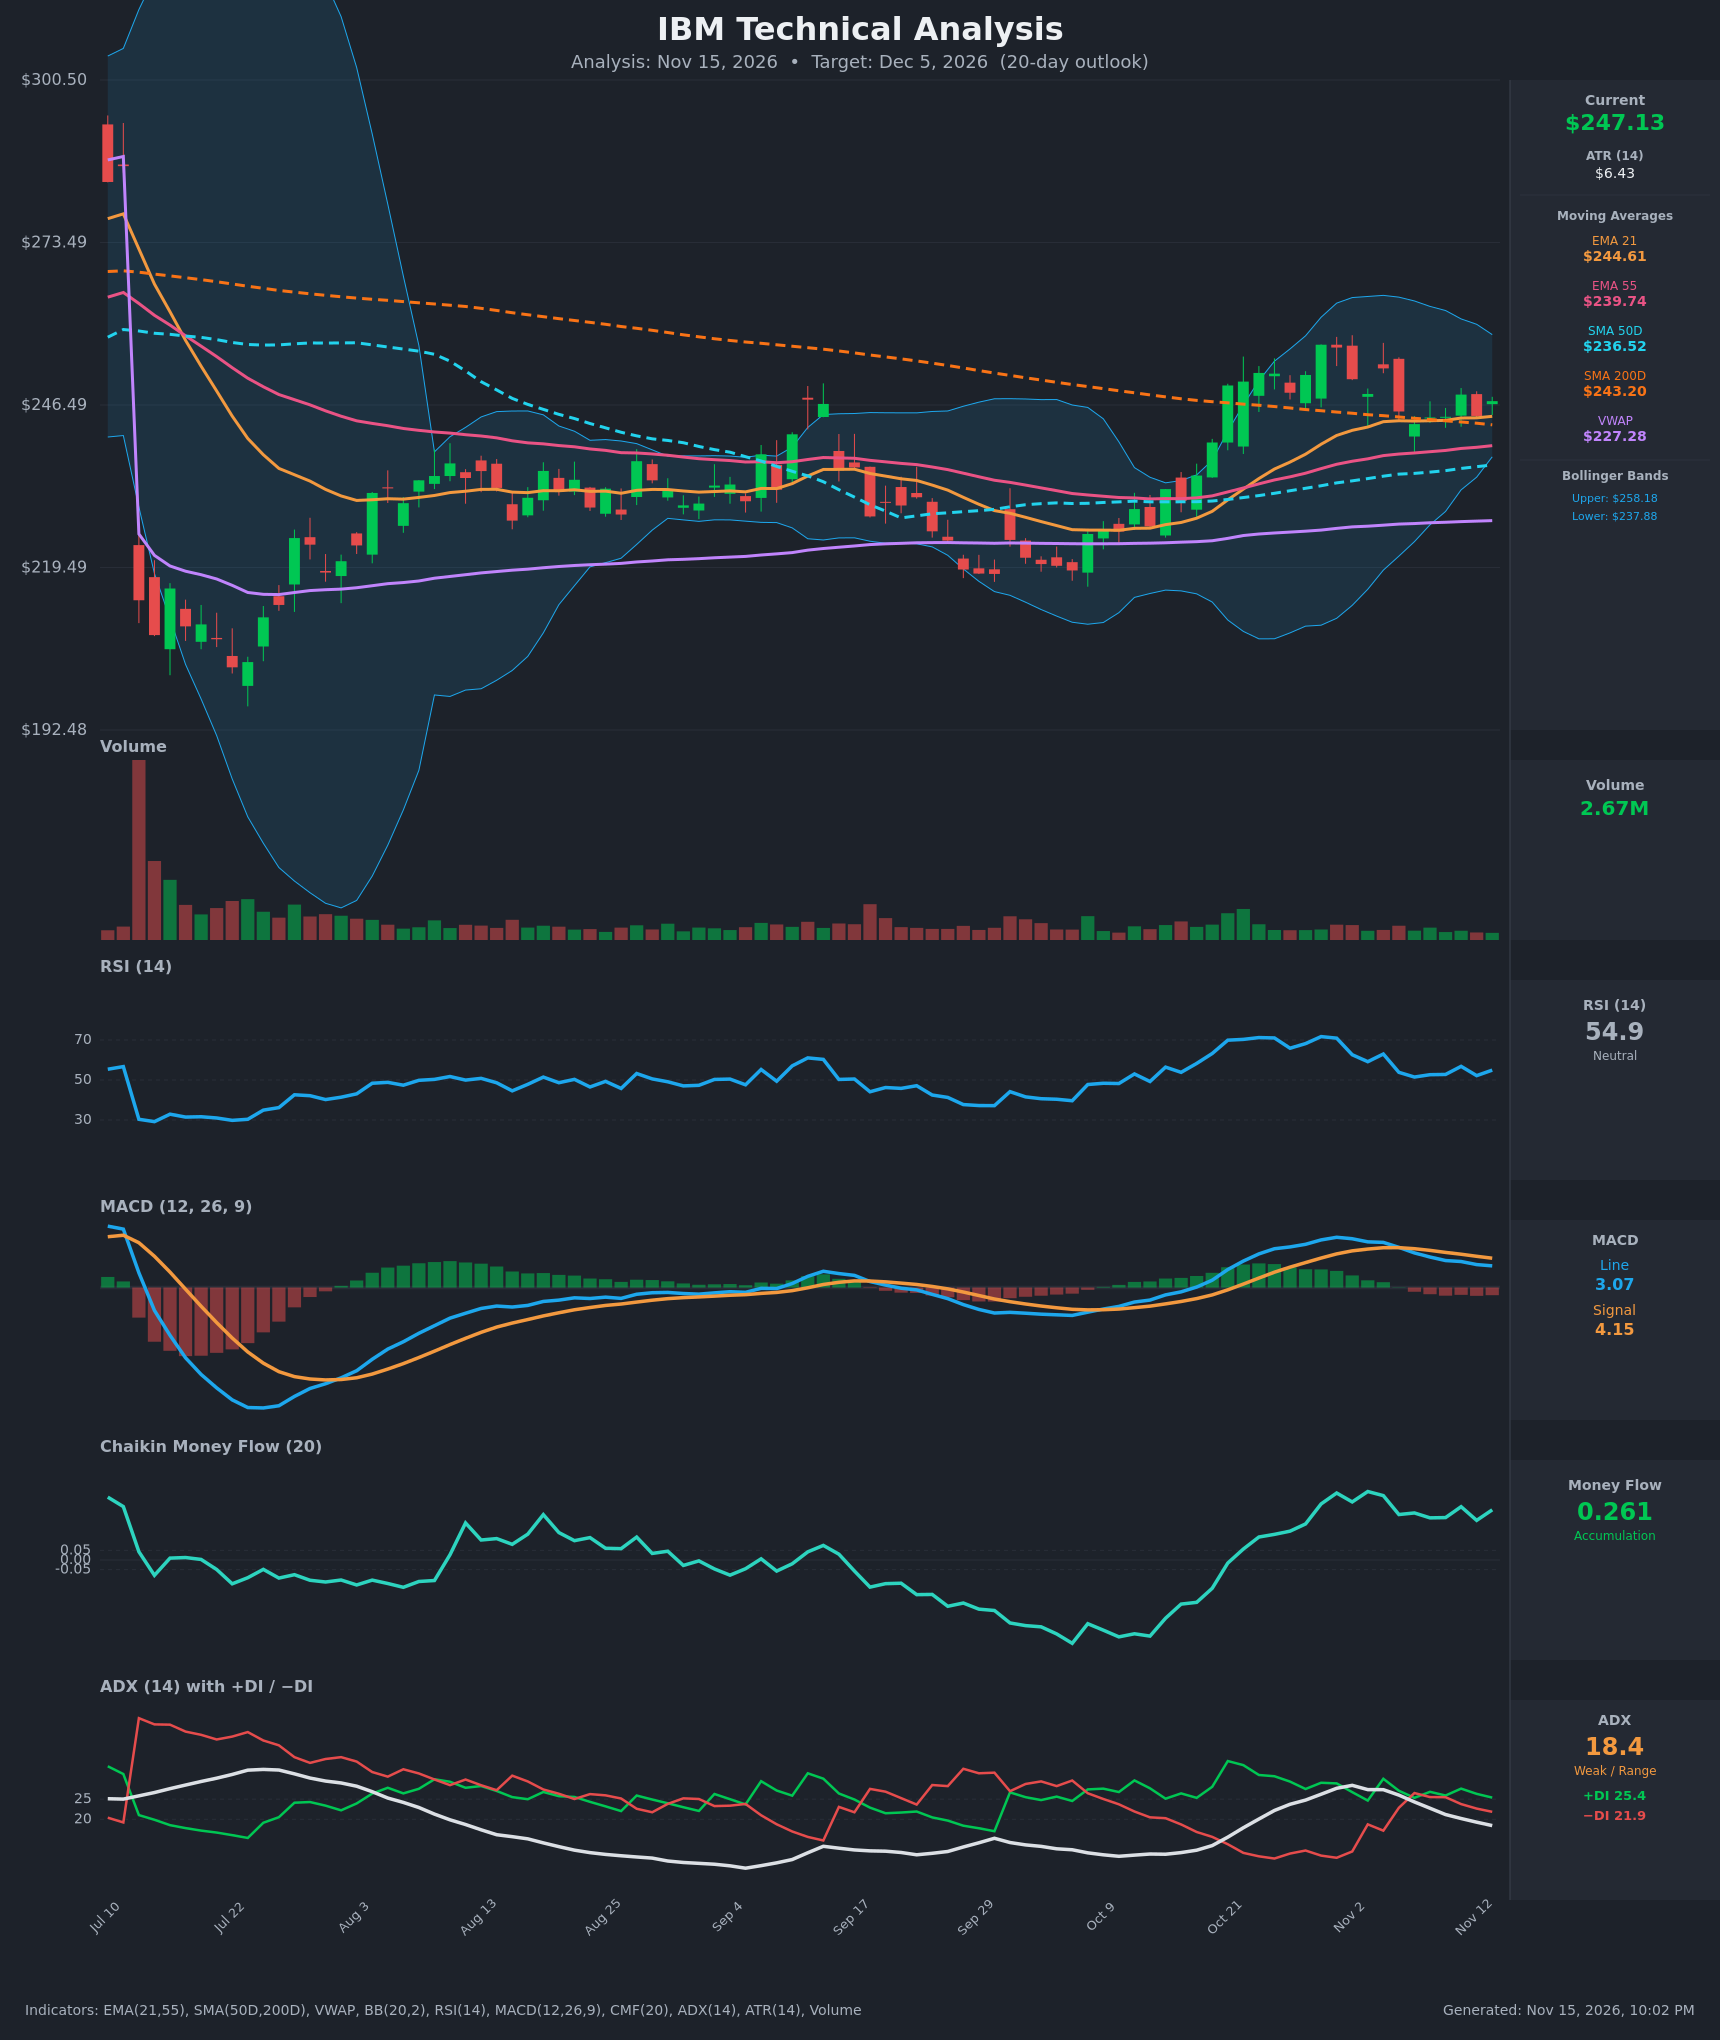
- RSI (14): 54.93, near the 50 midline. It has cooled from 71 on Oct 29 and has held between 51 and 57 for the past week. Momentum is neither overbought nor oversold, and the cooling has fully reset the earlier overbought reading. [Neutral]
- 20 EMA: The EMA 21 is $244.61 and price at $247.13 is above it. The EMA 21 is above the EMA 55 ($239.74), and the stack is still rising slowly. Price tested it on Nov 5–6 and held, so it acts as near-term support. [Bullish]
- MACD: The line is 3.07 and the signal is 4.15. The line crossed below the signal around Nov 5–6, and the histogram has been negative and slowly shrinking in size since then. The line is still positive but has fallen from 7.1 to 3.1, so short-term momentum has faded. [Bearish]
- Bollinger Bands (20): Upper $258.18, lower $237.88, midline about $248. Price sits almost exactly at the midline. The bands have narrowed from the October expansion, which points to consolidation and a possible volatility expansion. [Neutral]
- CMF (20): 0.261, well above +0.05, and it has stayed above 0.20 for the whole pullback. Buyers are absorbing the sideways drift, so this is sustained accumulation despite flat price. [Accumulation]
- ADX (14): 18.4 and falling from 28.4 on Nov 2, so the trend is weak and range-bound. +DI (25.4) is back above −DI (21.9) after a brief bearish DI crossover on Nov 5–10, which gives a slight bullish edge. [Weak Trend, slight bullish lean]
- Volume: 2.67M, which is subdued. Volume is light during the consolidation and was heavier during the October breakout. Declining volume in a tight range is typical of a pause rather than distribution. [Neutral to mildly bullish]
Other moving averages and VWAP:
- Price is above the SMA 50 ($236.52), and about 1.6% above the SMA 200 ($243.20), which it only recently reclaimed.
- VWAP ($227.28) is far below price, so buyers from the cycle are in profit.
- The SMA 50 is closing in on the SMA 200: the gap has narrowed from about $14.4 to $6.7. A golden cross is not confirmed, but it is a possible catalyst if price holds.
DIVERGENCES & TRENDS
- MACD vs. price: Price has held in a $243–$252 band while MACD has dropped from 7.1 to 3.1. This is momentum decay rather than a true divergence, and it fits a consolidation.
- CMF vs. price: CMF has stayed strong (0.20–0.35) while price drifted sideways. This is a mild bullish divergence, with accumulation under the surface.
- ADX: The trend-strength reading has fallen from 28 to 18, which confirms the October trend has paused. A turn up in ADX with +DI leading would signal the next leg.
- Crossovers: The MACD bearish cross (Nov 5–6) has not led to a breakdown. The −DI/+DI cross was reversed. EMA 21 remains above EMA 55 with no cross.
- SMA 200: Price is hugging it ($243.20), and it is acting as a pivot. The SMA 200 has been sloping down gently, so the trend filter is nearly flat.
CHART PATTERNS
- Bullish Flag / Pennant (continuation): After the sharp October rally from about $225 to $256, price has formed lower highs ($256.5, then $252.6, then $248.2) against a flat floor around $243–$245. This resembles a bullish pennant or flag.
- A breakout above about $252.6 to $256.5 would target the $262–$268 area, which is a partial measured move from the pole.
- A close below $243 would invalidate the pattern.
- Secondary read: A symmetrical triangle with a narrowing Bollinger Band width. Weak ADX supports a coil, and the breakout direction should follow the prior uptrend and the accumulation in CMF.
POTENTIAL SCENARIOS
- Scenario 1: Bullish Pennant Breakout — Price holds the $243–$245 support cluster (SMA 200 and EMA 21) and breaks out of the consolidation. Accumulation (CMF 0.26) and +DI leadership support this, and MACD can re-cross as the histogram flattens. Trigger: daily close above $252.60 on rising volume. Target: $256.50 first, then $260–$262. Invalidation: daily close below $242.50. (50% probability)
- Scenario 2: Neutral Continued Consolidation — Weak ADX keeps price pinned between the SMA 200 and the October highs, so it ends the period near the current level. Trigger: failure to close above $252.60 or below $243. Target: $244–$252. Invalidation: close outside $240–$256. (27% probability)
- Scenario 3: Bearish Breakdown — The MACD momentum fade continues, price loses the SMA 200 and EMA 21, and the failed Oct 29 high leads to a lower-high structure. Trigger: daily close below $243 with volume expansion. Target: $237.90 (lower Bollinger Band), then the SMA 50 near $236.50. Invalidation: reclaim of $249 on a closing basis. (23% probability)
PRICE TARGETS
- Target Price: $252.50 (20-day, Dec 5, 2026)
- Expected Range: $236.50 to $262.00 (width $25.50, about 10.3% of the current price, consistent with the 14–21 day guidance and with ATR of $6.43)
- Key Levels: Support at $243.20 (SMA 200, with the EMA 21 just above at $244.61 and the SMA 50 at $236.52 below), Resistance at $256.50 (Oct 29 high, near the upper Bollinger Band at $258.18)
OVERALL BIAS
OVERALL BIAS: BULLISH - Price is above all key moving averages and the SMA 200, CMF shows strong sustained accumulation (0.26), and +DI is back above −DI. The pennant-like consolidation after the October rally favors an upside continuation. The main counterweights are the negative MACD cross and the low ADX, so conviction is moderate.
This is educational analysis and not financial advice.