IBM 62-day bullish forecast — Nov 15, 2026
- Bias: Bullish
- Timeframe: 62 days (made Nov 15, 2026, target date Jan 15, 2027)
- Price at analysis: $247.13
- Price target: $259.00
- Expected range: $230.00 – $280.00
- Result: Pending — graded after the close on Jan 15, 2027
Get a free AI analysis of IBM today
Analysis
TECHNICAL INDICATORS
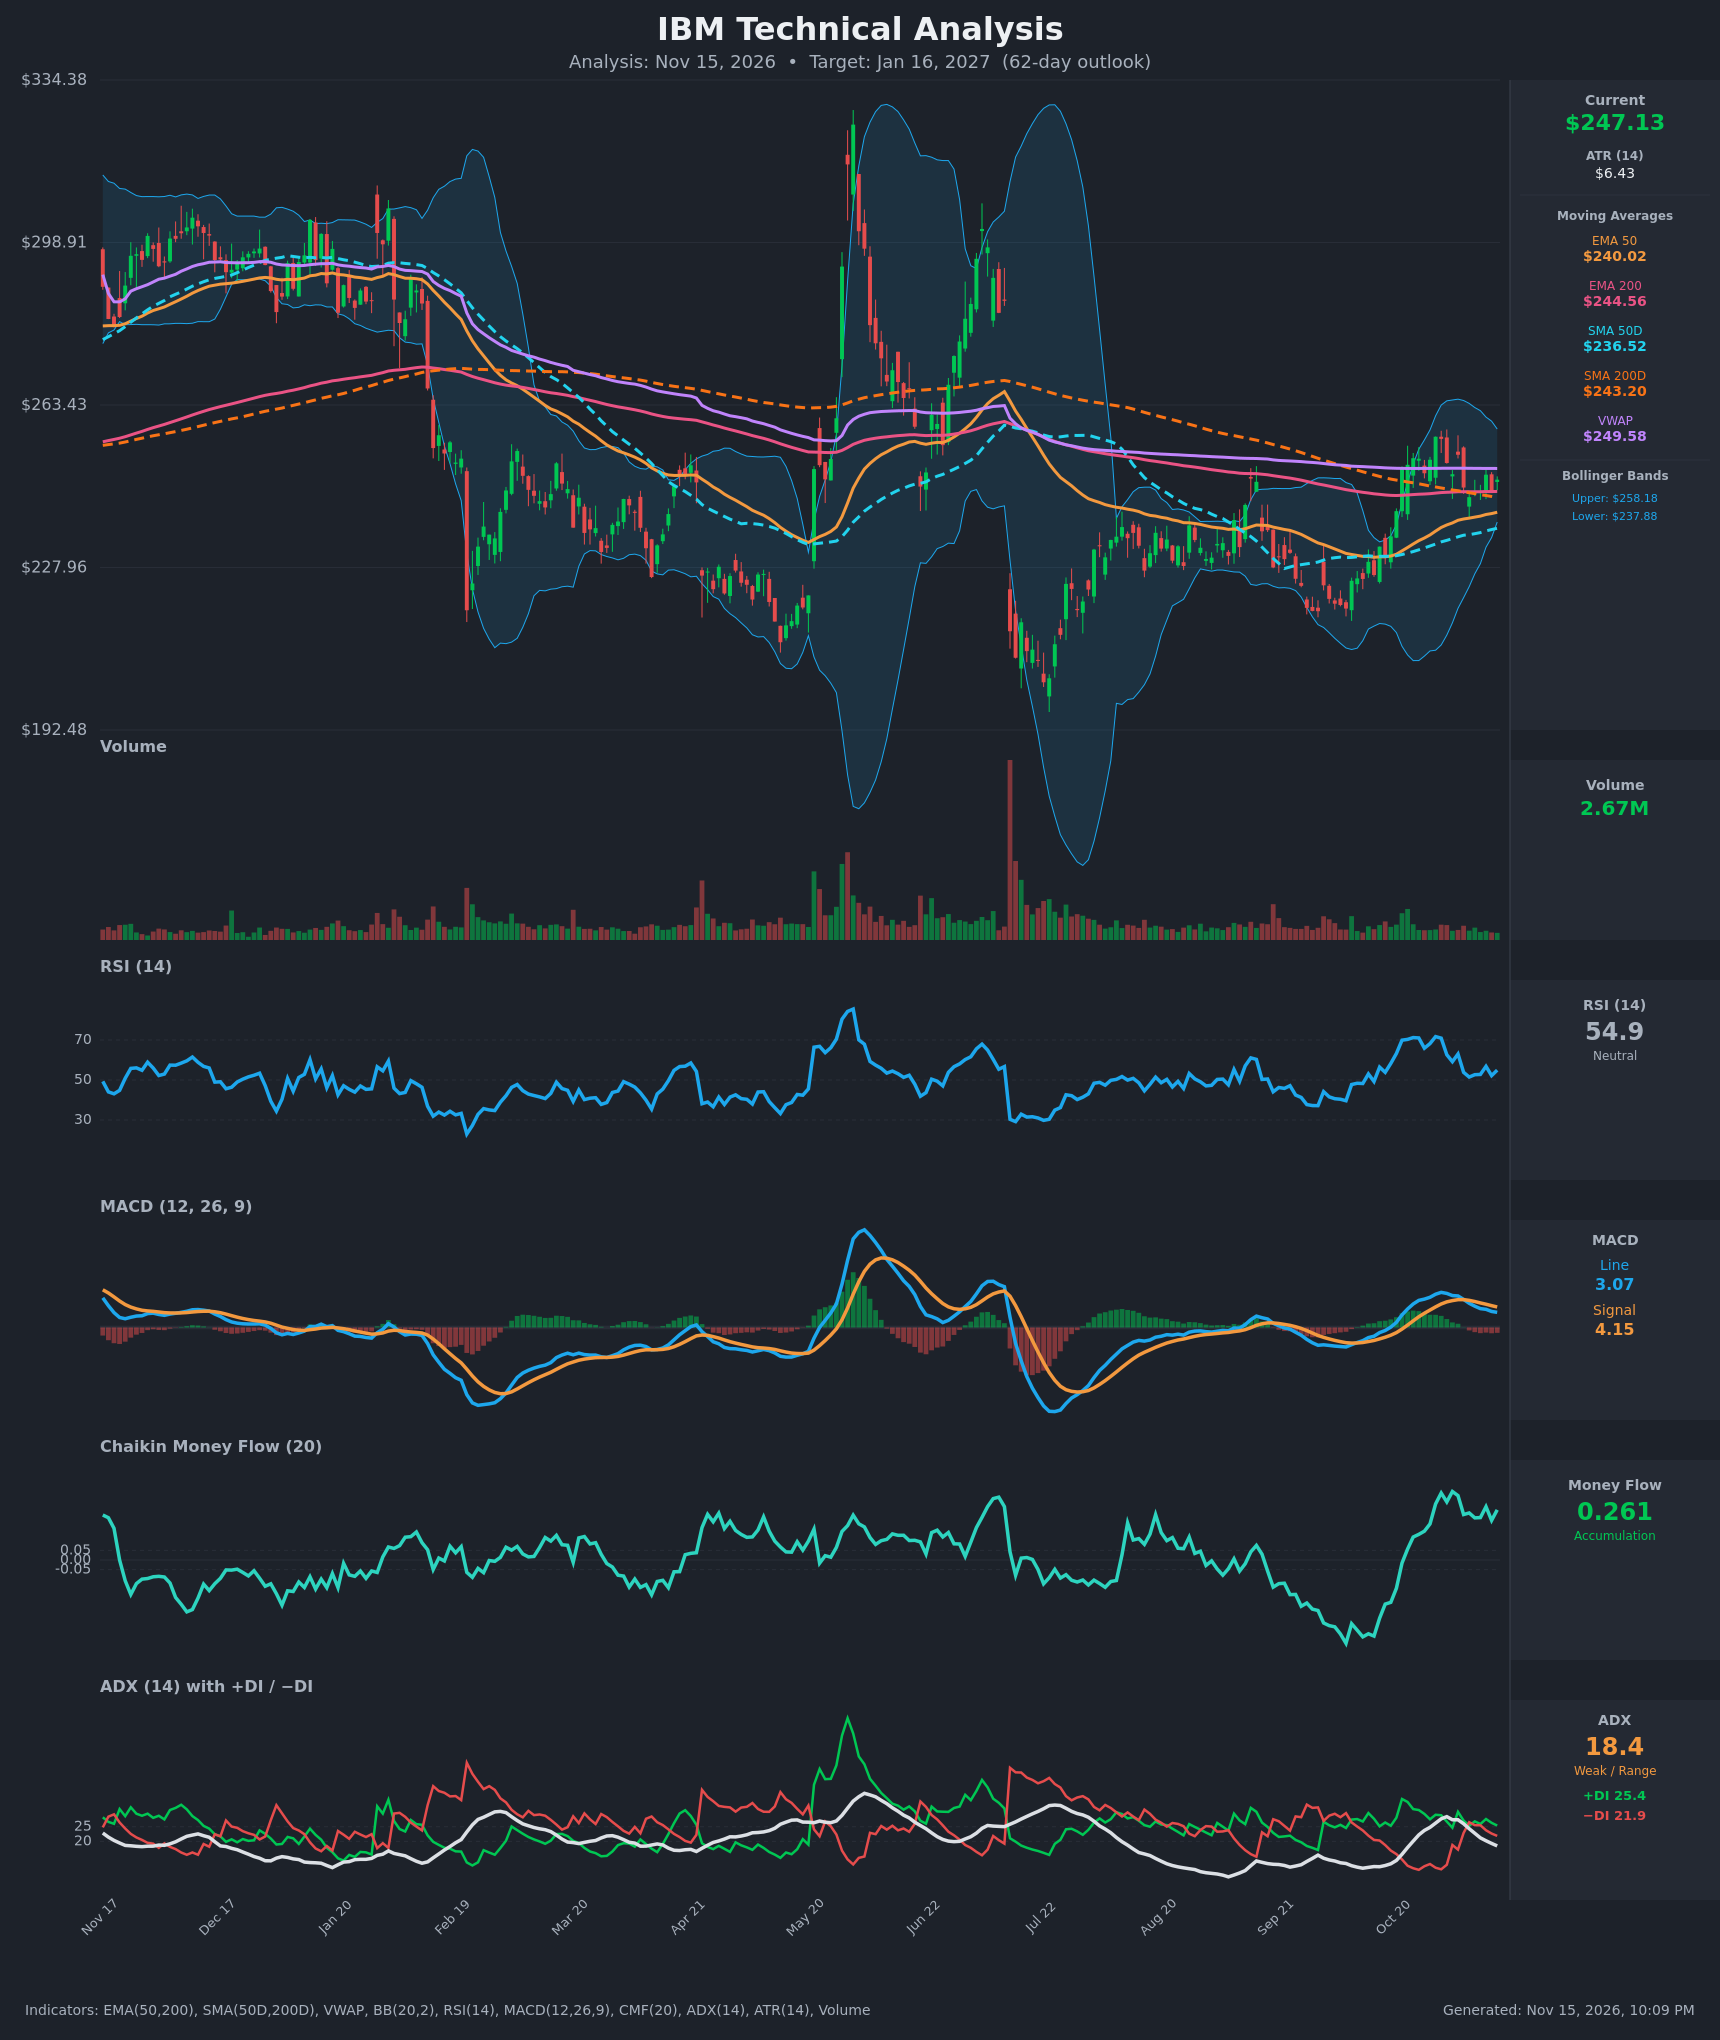
- RSI (14): 54.93, mid-range and neutral. It has cooled from overbought readings above 70 on Oct 26-30 and has held in the low-50s since Nov 5. There is no divergence, and momentum has reset without breaking down. [Neutral]
- 20 EMA: The 20 EMA is not supplied. The EMA 50 at $240.02 is rising and sits below price ($247.13), acting as support. The EMA 200 at $244.56 is flat and has just been reclaimed. Price is above both, though only about 1% above the EMA 200. [Bullish]
- MACD: Line 3.07 is below signal 4.15, so the histogram is negative and shrinking in size. The bearish crossover happened around Nov 5-6 and the line is still drifting lower. This is fading momentum, not a strong sell signal, and the line remains above zero. [Bearish]
- Bollinger Bands (20): Upper $258.18, lower $237.88, midline about $248. Price sits almost exactly on the midline after being rejected near the upper band ($256.5) on Oct 29-30. The bands have expanded off a squeeze and are now stable, so this is consolidation within a recovering structure. [Neutral]
- CMF (20): 0.261, well above +0.05, and sustained positive since mid-Oct (rising from deeply negative in Sep). Buyers have absorbed the recent pullback, with no distribution during the Nov 5-12 dip. [Accumulation]
- ADX (14): 18.4 and falling, below 20, so the trend is weak or range-bound. +DI (25.4) is above −DI (21.9) after briefly flipping on Nov 6-10, which gives bulls a slight edge. [Weak Trend, slight bullish lean]
- Volume: 2.67M, light and below the spike days that marked prior breakouts and breakdowns. The pullback came on modest volume, which is not a distribution pattern, but there is no conviction yet either. [Neutral / low participation]
Other moving averages and VWAP:
- SMA 50D is $236.52 and SMA 200D is $243.20, a gap of about $6.7 that is narrowing as the SMA 50D rises and the SMA 200D declines. A golden cross is possible within the 62-day window.
- EMA 50 is $240.02 against EMA 200 at $244.56, a gap of about $4.5 that is also closing.
- VWAP is $249.58, just above price, and acts as near-term resistance.
DIVERGENCES & TRENDS
- Price vs. RSI: There is no divergence. RSI fell from 71 to 55 while price pulled back from $256 to $247, which is consistent.
- CMF vs. price: CMF has risen from about -0.2 in Sep to +0.26 while price made higher lows (about $222 to $240), a bullish accumulation trend.
- MACD vs. price: MACD is below its signal while price holds above the key averages. This is short-term momentum cooling inside an uptrend, and it could resolve either way.
- ADX: ADX peaked at 28.4 on Nov 2 and has decayed to 18.4, so the Oct impulse has finished and the market is entering a range.
- Crossovers:
- A bearish MACD cross occurred on Nov 5-6.
- +DI/−DI flipped briefly bearish on Nov 6-10 and has since reverted to bullish.
- The EMA 50 and SMA 50D are converging on their 200 counterparts, but no golden cross has occurred yet.
- Long-term context: The big picture is a downtrend from about $290 (Jan) to about $222 (Sep). Price is now retesting the 200-day cluster (about $243-245) from below and trying to hold above it. This is the first meaningful attempt to repair the longer-term trend.
CHART PATTERNS
- Bullish Flag / consolidation under resistance: After the Oct impulse from about $225 to $256, price is drifting in a $243-$257 range. It resembles a Bullish Flag Pattern or a rectangle. A breakout above $257-$258 projects the flagpole (about $30) to roughly $275-$285, though a full measured move is unlikely within 62 days.
- Base/higher-low structure: The Sep low at about $222 is followed by a higher swing low, resembling a shallow Bullish Double Bottom-style recovery. Its neckline is around $256-$258, and a close above it would confirm the pattern.
- Counter-pattern: The Oct 29-30 peak followed by a lower high in the $252 area could form a Bearish Double Top if $243 breaks. A close below $240 (EMA 50) would activate that pattern and target about $225-$230.
POTENTIAL SCENARIOS
- Scenario 1: Bullish Breakout Above Range — CMF accumulation and the converging moving averages favor a push through overhead resistance. MACD turns back up and the EMA 50 crosses above the EMA 200, with a possible golden cross. Trigger: daily close above $258 (BB upper and Oct highs) on rising volume. Target: $263-$270, with $259 as the 62-day base case. Invalidation: close below $240 (EMA 50). (50% probability)
- Scenario 2: Neutral Range Chop — Weak ADX (<20) and a flat 200-day cluster keep price oscillating between VWAP and the 200-day averages. Trigger: repeated rejections near $255-$258 and bounces from $240-$243. Target: $244-$252. Invalidation: a close outside $238-$259. (20% probability)
- Scenario 3: Bearish Failed Recovery — The negative MACD crossover extends and price loses the 200-day cluster, forming a lower high under the downward-sloping long-term trend. Trigger: close below $240 with a MACD move toward zero. Target: $228-$232, then the $222 Sep low. Invalidation: reclaim of $250 on volume. (30% probability)
PRICE TARGETS
For a 62-day horizon, the range width should be about 18-30% of the current price.
- Range width: $280.00 - $230.00 = $50.00, which is 20.2% of $247.13. This fits the 61-180 day guidance.
- Target Price: $259.00 (62 days, Jan 16, 2027)
- Expected Range: $230.00 to $280.00
- Key Levels: Support at $243.20 (SMA 200D, with the EMA 50 at $240.02 below it), Resistance at $258.18 (BB upper, near the Oct highs)
OVERALL BIAS
OVERALL BIAS: BULLISH - Strong sustained CMF accumulation, price above the rising EMA 50 and SMA 50D, +DI above −DI, and converging 50/200 averages favor an upside resolution of the current flag/consolidation. Conviction is modest because MACD is below its signal, ADX is weak, and VWAP and the $258 band cap near-term upside.
This is educational analysis and not financial advice.