IBM 48-day bullish forecast — Nov 15, 2026
- Bias: Bullish
- Timeframe: 48 days (made Nov 15, 2026, target date Jan 1, 2027)
- Price at analysis: $247.13
- Price target: $256.00
- Expected range: $238.00 – $274.00
- Result: Pending — graded after the close on Jan 1, 2027
Get a free AI analysis of IBM today
Analysis
TECHNICAL INDICATORS
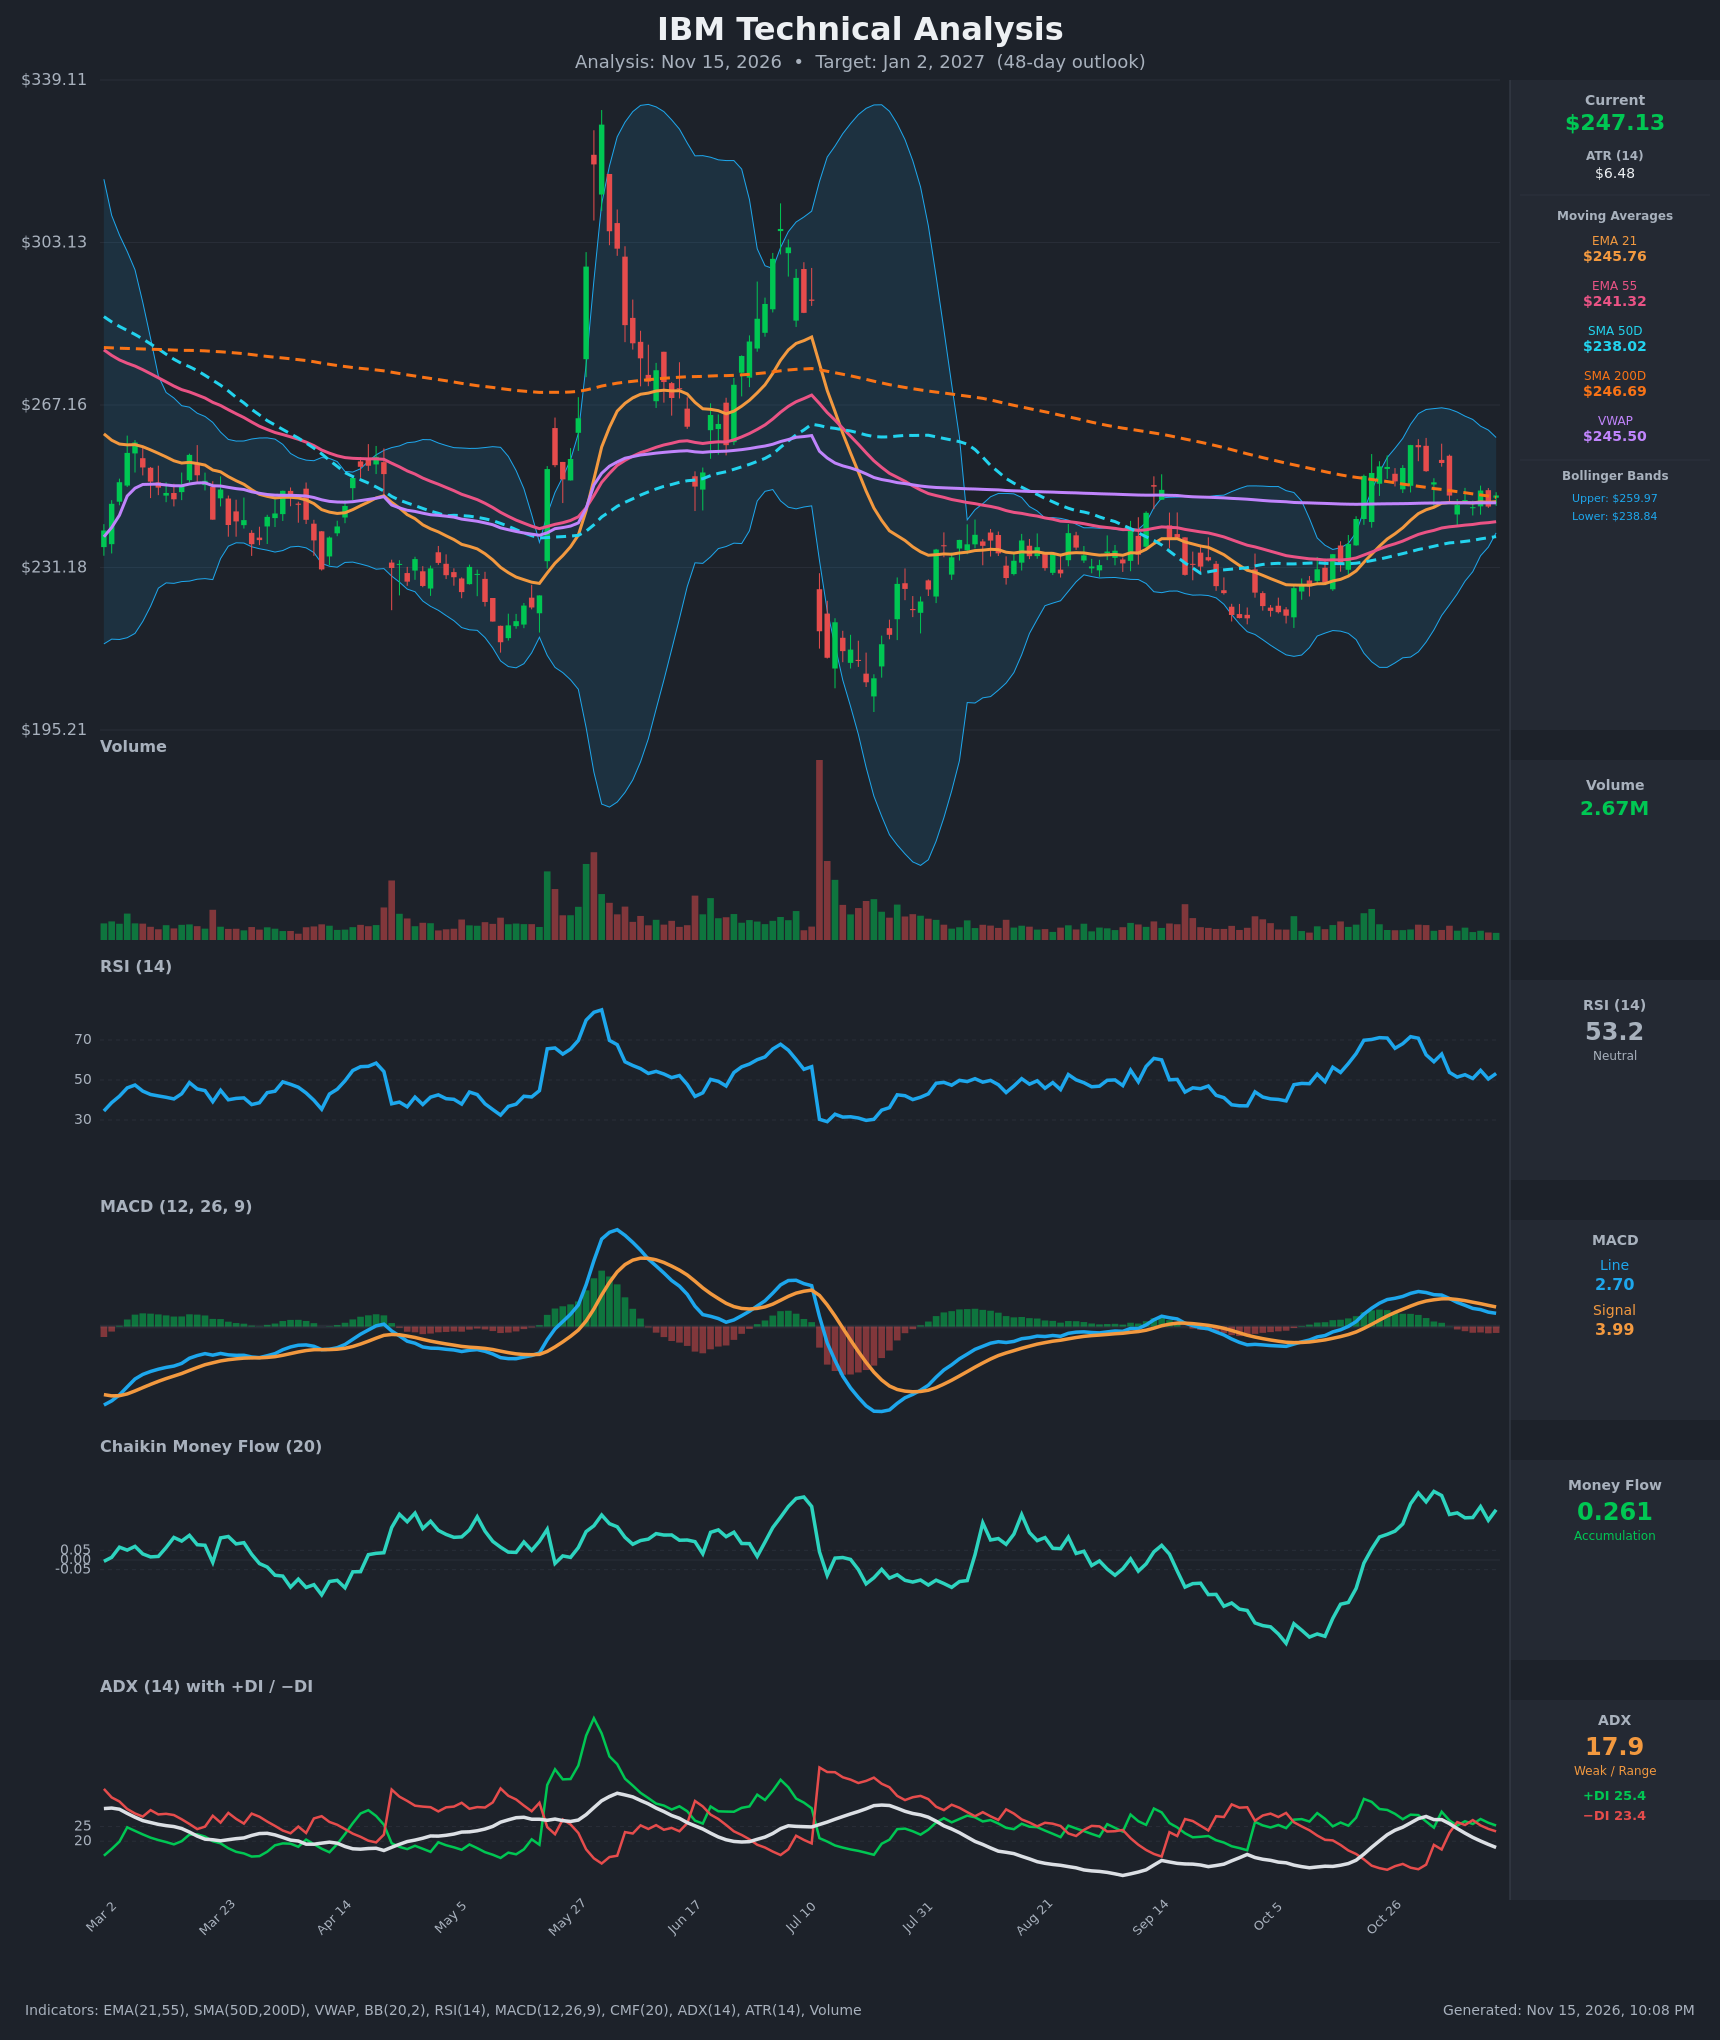
- RSI (14): 53.25, neutral. It has cooled from the 71-72 overbought peak on Oct 29-30 and has stabilized in the 50-55 zone for the last week. That points to a momentum reset, not a breakdown. [Neutral]
- 20 EMA: The 21 EMA is $245.76 and price ($247.13) sits just above it, so it is acting as near-term support. Price is also above the 55 EMA ($241.32) and the 21 EMA is above the 55 EMA, which keeps the short-term structure constructive. [Bullish]
- MACD: The line is 2.70 and the signal is 3.99. A bearish crossover happened around Nov 5-6 and the histogram is negative (about -1.3), so short-term momentum is fading. The line is still above zero and the histogram is shrinking in magnitude, which fits a pause after the rally, but it has not turned up yet. [Bearish]
- Bollinger Bands (20): The bands are $238.84 to $259.97, and price is in the upper-middle half. The bands have expanded from a squeeze in Sep-Oct. The upper band lines up with the Oct 29 swing high near $258, so that area is the main overhead test. [Neutral]
- CMF (20): 0.261, well above +0.05 and sustained for weeks. Buying pressure has held even during the pullback from $258 to $245, which suggests dips are being accumulated. [Accumulation]
- ADX (14): 17.9 and falling from 28.4, which is weak and range-bound. +DI (25.4) is only barely above -DI (23.4), after -DI briefly led on Nov 6-10. There is no directional edge from trend strength, so the move is a consolidation. [Weak Trend, slight bullish lean]
- Volume: 2.67M, light and declining during the pullback. Contracting volume during a pullback is typical of consolidation, not distribution, and there is no capitulation selling. [Neutral to mildly Bullish]
Moving-average context:
- Price is at the SMA200 ($246.69), which is flattening and falling slowly.
- The SMA50 ($238.02) is rising toward it, so a golden cross is plausible in the coming weeks.
- Price is above VWAP ($245.50), which marks the mid-range.
DIVERGENCES & TRENDS
- No clear divergence. Price made a lower high (258 to 254 to 248) while RSI made lower highs too (71.7 to 63 to 54), which is confirmation, not divergence.
- CMF vs. price/MACD: CMF stays strongly positive (0.2-0.35) while price pulls back and MACD rolls over. This mild bullish divergence suggests the pullback is a pause.
- MACD: The bearish signal-line cross on Nov 5-6 has the histogram still negative. A re-cross upward would be the first confirmation of renewed momentum.
- ADX: Down from 28 to 17.9 as the trend loses steam, which is consistent with a sideways digestion phase. The +DI/-DI spread has narrowed to almost nothing.
- Moving averages: The SMA50 is converging on the SMA200 from below (the gap has shrunk from about 17 to about 8.7 points over 15 bars). The 21 EMA is above the 55 EMA, so there is no bearish EMA cross.
CHART PATTERNS
- Bullish Pennant / Flag (continuation): After the Oct rally from about $222 to $258, price is consolidating with lower highs ($258, $254, $248) and higher/flat lows (about $244-245). Volume is contracting, which fits a pennant. A break above about $250-254 would favor continuation.
- Measured move: The pole is about $36, so the theoretical pennant target is around $280. For 48 days I would not rely on the full move because ADX is weak and the SMA200 and Bollinger upper band cap the first leg.
- Alternative reading: If price loses $244-245 (EMA21/VWAP) and then $241 (EMA55), the structure looks more like a failed rally or a bearish flag, with a pullback toward the $238 SMA50 and lower band.
- Range context: The longer picture since March is a wide $220-$270 range (excluding the May-June spike), and price is sitting at the SMA200. That is a decision point.
POTENTIAL SCENARIOS
- Scenario 1: Bullish Pennant Breakout and Golden Cross — Price holds the $244-246 cluster (EMA21, VWAP, SMA200), MACD re-crosses upward, and the SMA50 crosses above the SMA200. CMF accumulation drives a push through the Oct high. Trigger: daily close above $254 on rising volume. Target: $256-$265 (the first stop is the $258-260 swing high and upper Bollinger Band). Invalidation: daily close below $241. (50% probability)
- Scenario 2: Neutral Range-Bound Chop — With ADX below 20, price oscillates between the EMA55 (~$241) and the Oct high (~$258) around the SMA200, ending the period near the current level. Trigger: failed breakouts on both sides and ADX staying below 20. Target: $243-$252. Invalidation: close above $258 or below $238. (25% probability)
- Scenario 3: Bearish Failed Rally — The MACD bearish cross extends, -DI retakes the lead, and the SMA200 rejection turns into a pullback toward the SMA50 and lower band. Trigger: close below $241.32 with expanding volume. Target: $230-$238. Invalidation: reclaim of $250 on a daily close. (25% probability)
PRICE TARGETS
Timeframe: 48 days (30-60 day guidance of about 12-18% width). Range width check: $274.00 - $238.00 = $36.00, which is 14.6% of $247.13, in line with guidance.
- Target Price: $256.00 (48-day target, about +3.6%)
- Expected Range: $238.00 to $274.00
- Key Levels: Support at $241.32 (EMA55), Resistance at $258.28 (Oct 29 swing high, near the upper Bollinger Band)
OVERALL BIAS
OVERALL BIAS: BULLISH - Price is above the 21/55 EMAs and VWAP, sitting on the SMA200 with the SMA50 closing in for a possible golden cross. CMF shows sustained accumulation and volume is contracting on the pullback, which fits a pennant. The conviction is modest because MACD is below its signal line and ADX is weak, so a drop through $241 would flip the view.
This is educational analysis and not financial advice.