IBM 27-day bullish forecast — Nov 15, 2026
- Bias: Bullish
- Timeframe: 27 days (made Nov 15, 2026, target date Dec 11, 2026)
- Price at analysis: $247.13
- Price target: $254.00
- Expected range: $230.00 – $266.00
- Result: Pending — graded after the close on Dec 11, 2026
Get a free AI analysis of IBM today
Analysis
TECHNICAL INDICATORS
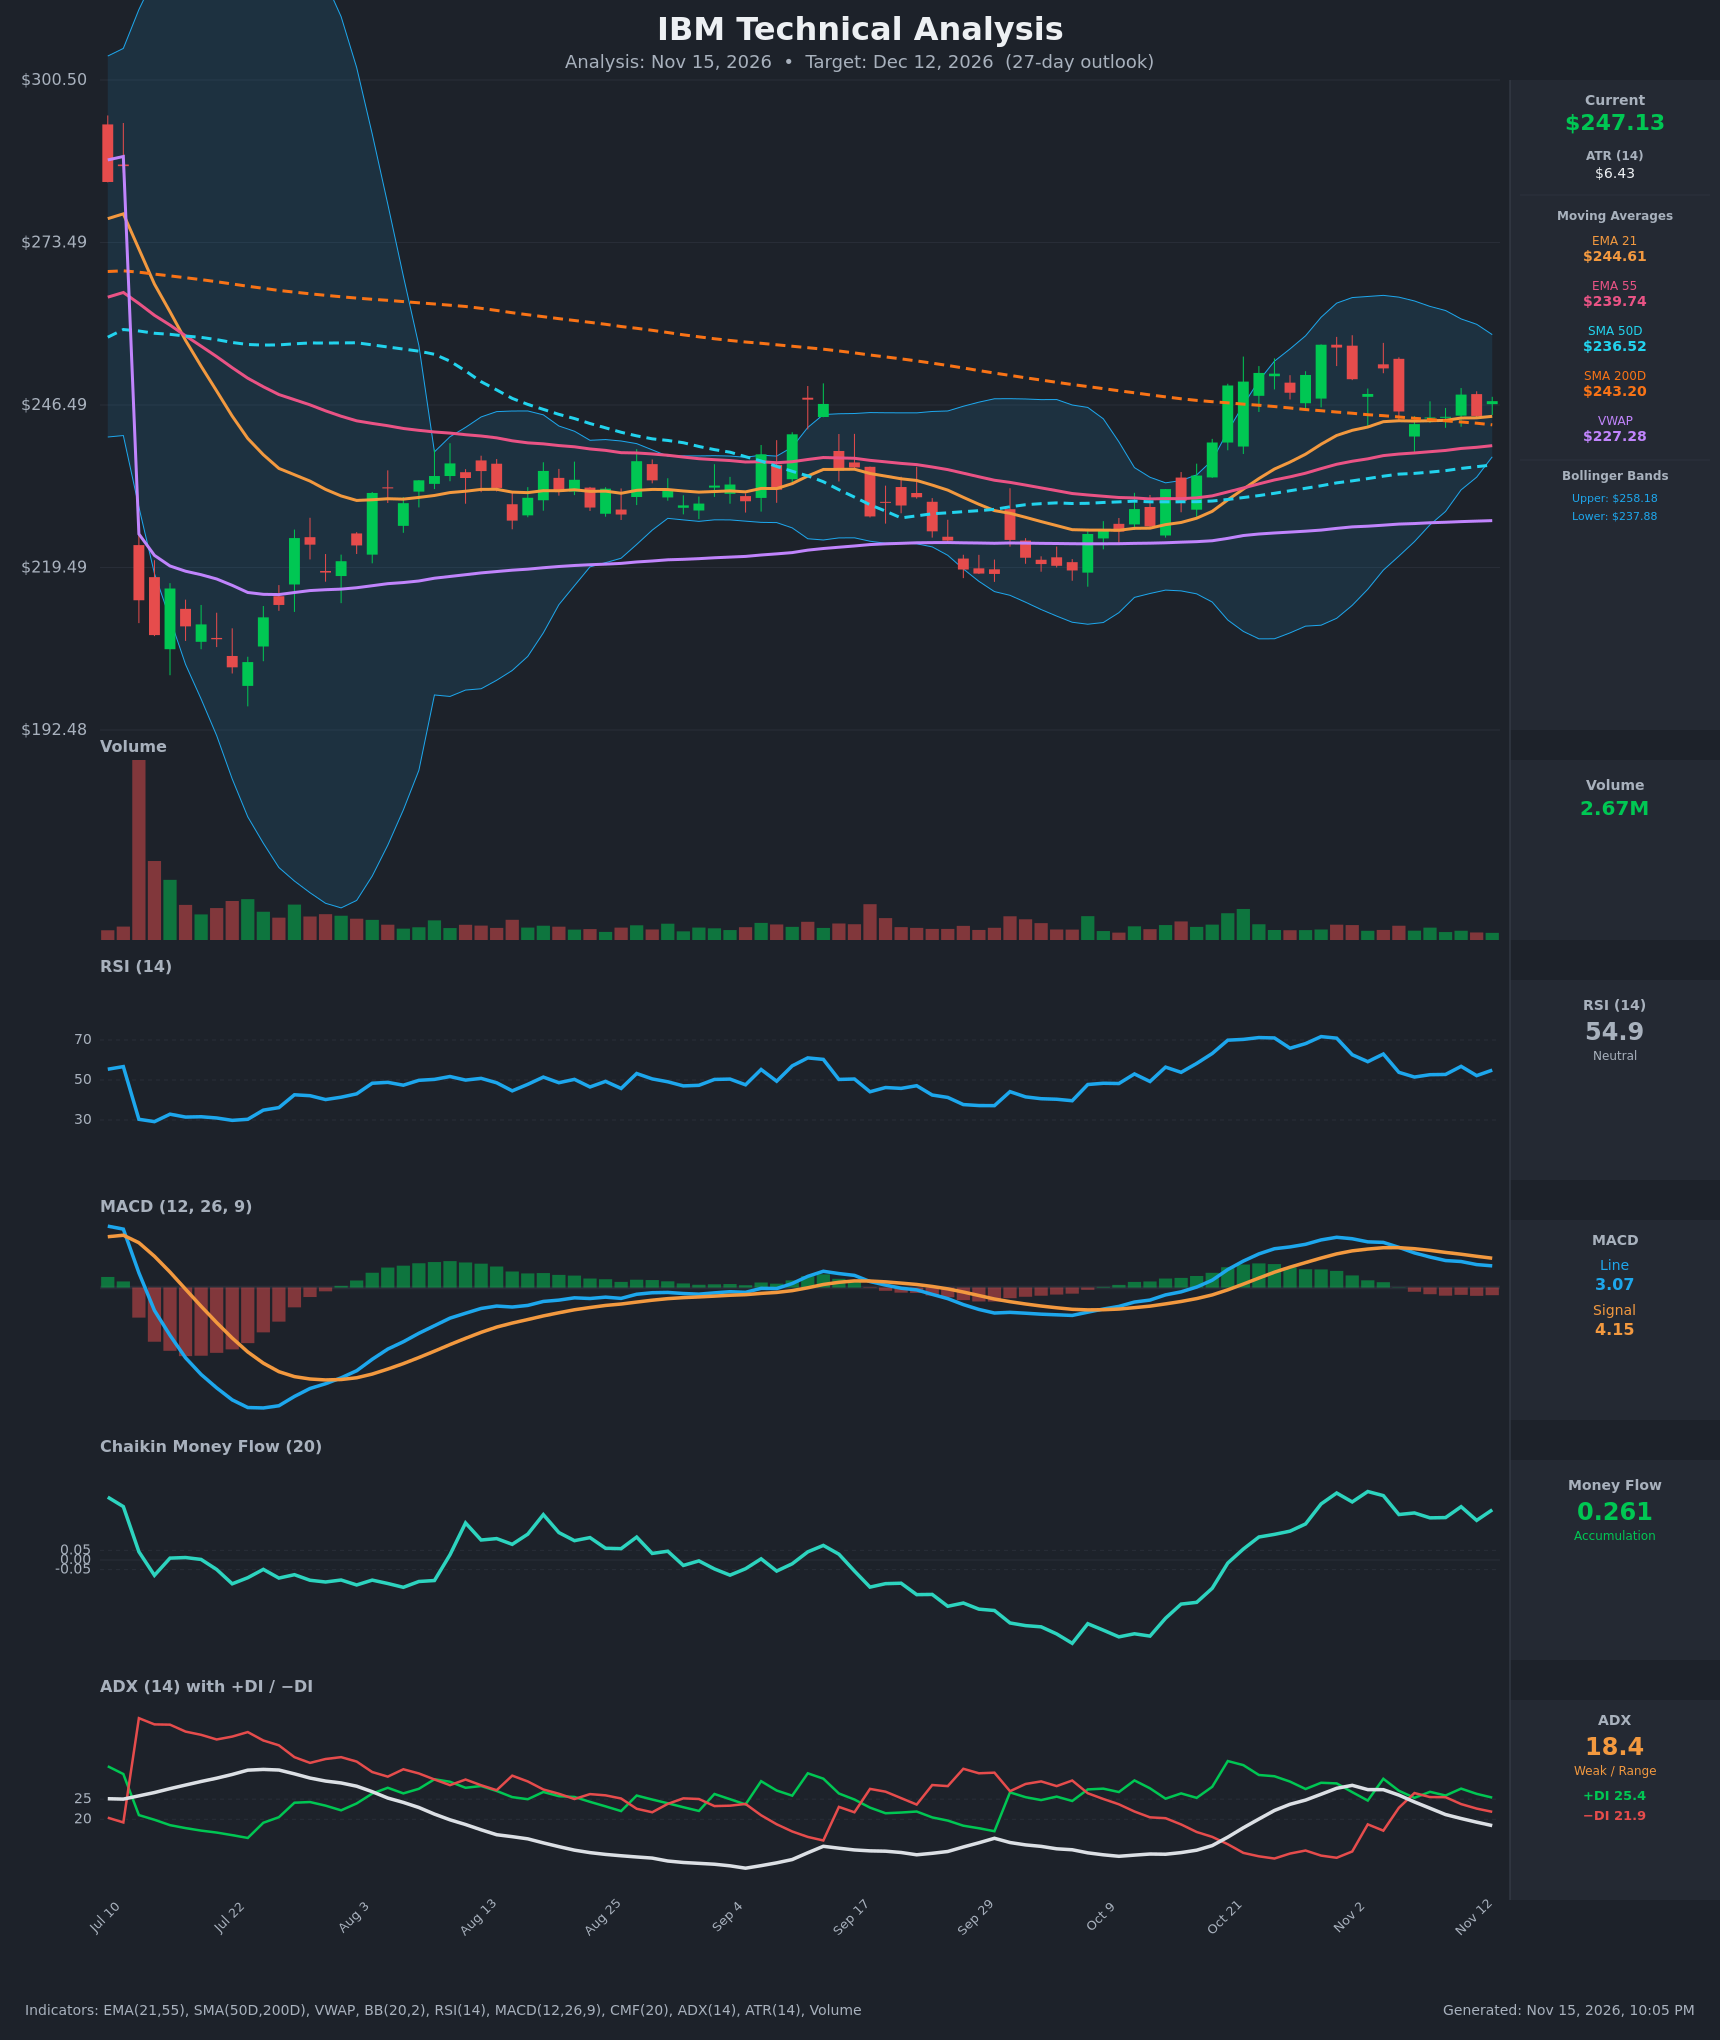
- RSI (14): 54.93, back to neutral after peaking at ~71.7 on Oct 29. It has been oscillating between 52 and 63 for the past week, so momentum is flat with a slight upward tick from 52.2 to 54.9. [Neutral]
- 20 EMA: The EMA21 is $244.61 and price ($247.13) sits above it. It has been flat to slightly rising for the last 5 bars, and price has repeatedly held it on pullbacks (Nov 6, Nov 12). The EMA21 is above the EMA55 ($239.74), so the bullish alignment is intact. [Bullish]
- MACD: The line (3.07) is below the signal (4.15), and the histogram is negative at about -1.08. The bearish crossover happened around Nov 5, and the line has fallen from 7.11 to 3.07. The histogram is shrinking in magnitude only slowly, so short-term momentum is still fading. [Bearish]
- Bollinger Bands (20): The bands run from $237.88 to $258.18, with the midline near $248. Price sits at the midline, roughly 46% of the way up the band. The bands are moderately wide after the October rally, with no squeeze or breakout. [Neutral]
- CMF (20): 0.261, well above +0.05 and sustained positive since mid-Oct (0.13 to 0.36). Buying pressure has persisted through the pullback, which is a notable divergence from the softer MACD. [Accumulation]
- ADX (14): 18.4 and falling from a peak of 28.4 on Nov 2, which marks a weak, range-bound regime. +DI (25.4) is above −DI (21.9) with a narrow spread, after a brief −DI lead on Nov 6. This gives a slight bullish tilt but no trend conviction. [Weak Trend, slight bullish bias]
- Volume: 2.67M, light and declining through the consolidation. Volume spiked on the Oct 21-22 breakout and has faded during the pullback, which is typical of a healthy digestion phase rather than distribution. [Neutral to mildly bullish]
Moving-average context:
- Price is above the SMA200 ($243.20) for the first time in months, though only by about 1.6%.
- Price is above the SMA50 ($236.52) and well above VWAP ($227.28).
- The SMA50 is rising (about +0.3/day) while the SMA200 is falling (about -0.2/day). The $6.7 gap is closing at roughly $0.5/day, so a golden cross is plausible in about 2 weeks (late Nov), inside the forecast window.
DIVERGENCES & TRENDS
- MACD vs CMF: MACD has been bearish since Nov 5 and is below its signal line, while CMF is strongly positive. Money flow is not confirming the momentum fade, so the pullback looks corrective.
- Price vs RSI: Price made a high of about $256.5 on Oct 29-30 with RSI near 71. The subsequent lower highs ($252.57, $248.22) came with RSI at 63 and 57, which is normal cooling with no clear bearish divergence.
- ADX: It dropped from 28 to 18 as the DI spread collapsed. The trend phase is over, and the market is consolidating and awaiting a catalyst.
- EMA/SMA structure: The EMA21 is above the EMA55, which was crossed bullishly in late Oct. The SMA50 is converging on the SMA200 (pre-golden cross).
- SMA200 interaction: Price is oscillating around the SMA200 ($243-244), so it is acting as a pivot.
- MACD: The bearish crossover is the only major negative signal.
CHART PATTERNS
- Bullish Flag / Pennant (continuation): After the Oct 9 to Oct 29 impulse from ~$222 to ~$256.5, price has consolidated in a tightening $243-$252 range on declining volume. This fits the Bullish Flag/Pennant. A breakout above ~$252.6 to $256.5 would project a measured move of about $20-30. Realistically, that means a retest of the $256-$260 zone, with an extension toward $265+ as the upside tail.
- Caution, minor Double Top: The $256.51 and $256.04 highs on Oct 29-30 resemble a Bearish Double Top. It would only be confirmed by a break below the neckline at ~$243-$244 (the SMA200/EMA21 zone, also the Nov 5-6 lows). Such a break targets about $230-$232.
- Pre-golden cross: The SMA50 is closing in on the SMA200 and supports the bullish continuation case.
POTENTIAL SCENARIOS
- Scenario 1: Bullish Flag Breakout and Golden Cross — Consolidation resolves upward as CMF accumulation carries through and the MACD histogram turns up. The SMA50/SMA200 golden cross adds a supportive tailwind. Trigger: daily close above $252.60, then above $256.50 on rising volume. Target: $256-$262 (stretch $265). Invalidation: daily close below $243 (SMA200/EMA21). (50% probability)
- Scenario 2: Neutral Range Consolidation — Weak ADX (18.4) keeps price chopping between the SMA200/EMA21 floor and the $252-$256 ceiling. Trigger: continued failure to clear $252.6 and no close below $243. Target: $243-$252. Invalidation: a close outside the $240-$257 range. (28% probability)
- Scenario 3: Bearish Double Top Breakdown — The MACD bearish crossover extends, price loses the SMA200/EMA21 cluster and the $256.5 double top plays out. Trigger: daily close below $243 and then below $240. Target: $232-$237 (the SMA50 and lower Bollinger Band area). Invalidation: reclaim of $249 on strong volume. (22% probability)
PRICE TARGETS
27-day horizon (target date Dec 12). Self-check: range width is $266.00 − $230.00 = $36.00, which is 14.6% of $247.13. That is within the 12-18% guidance for 30-60 days and appropriately scaled for 27 days.
- Target Price: $254.00 (about +2.8% from the current price)
- Expected Range: $230.00 to $266.00
- Key Levels: Support at $243.20 (SMA200, with the EMA21 just above at $244.61), Resistance at $256.50 (Oct 29 swing high)
OVERALL BIAS
OVERALL BIAS: BULLISH - Price is above all key moving averages, with CMF showing strong sustained accumulation and a flag-type consolidation after the October impulse. A SMA50/SMA200 golden cross is approaching. The main offsets are the bearish MACD crossover and weak ADX, which keep conviction modest.
This is educational analysis and not financial advice.