IBM 34-day bullish forecast — Nov 15, 2026
- Bias: Bullish
- Timeframe: 34 days (made Nov 15, 2026, target date Dec 18, 2026)
- Price at analysis: $247.13
- Price target: $252.00
- Expected range: $232.00 – $270.00
- Result: Pending — graded after the close on Dec 18, 2026
Get a free AI analysis of IBM today
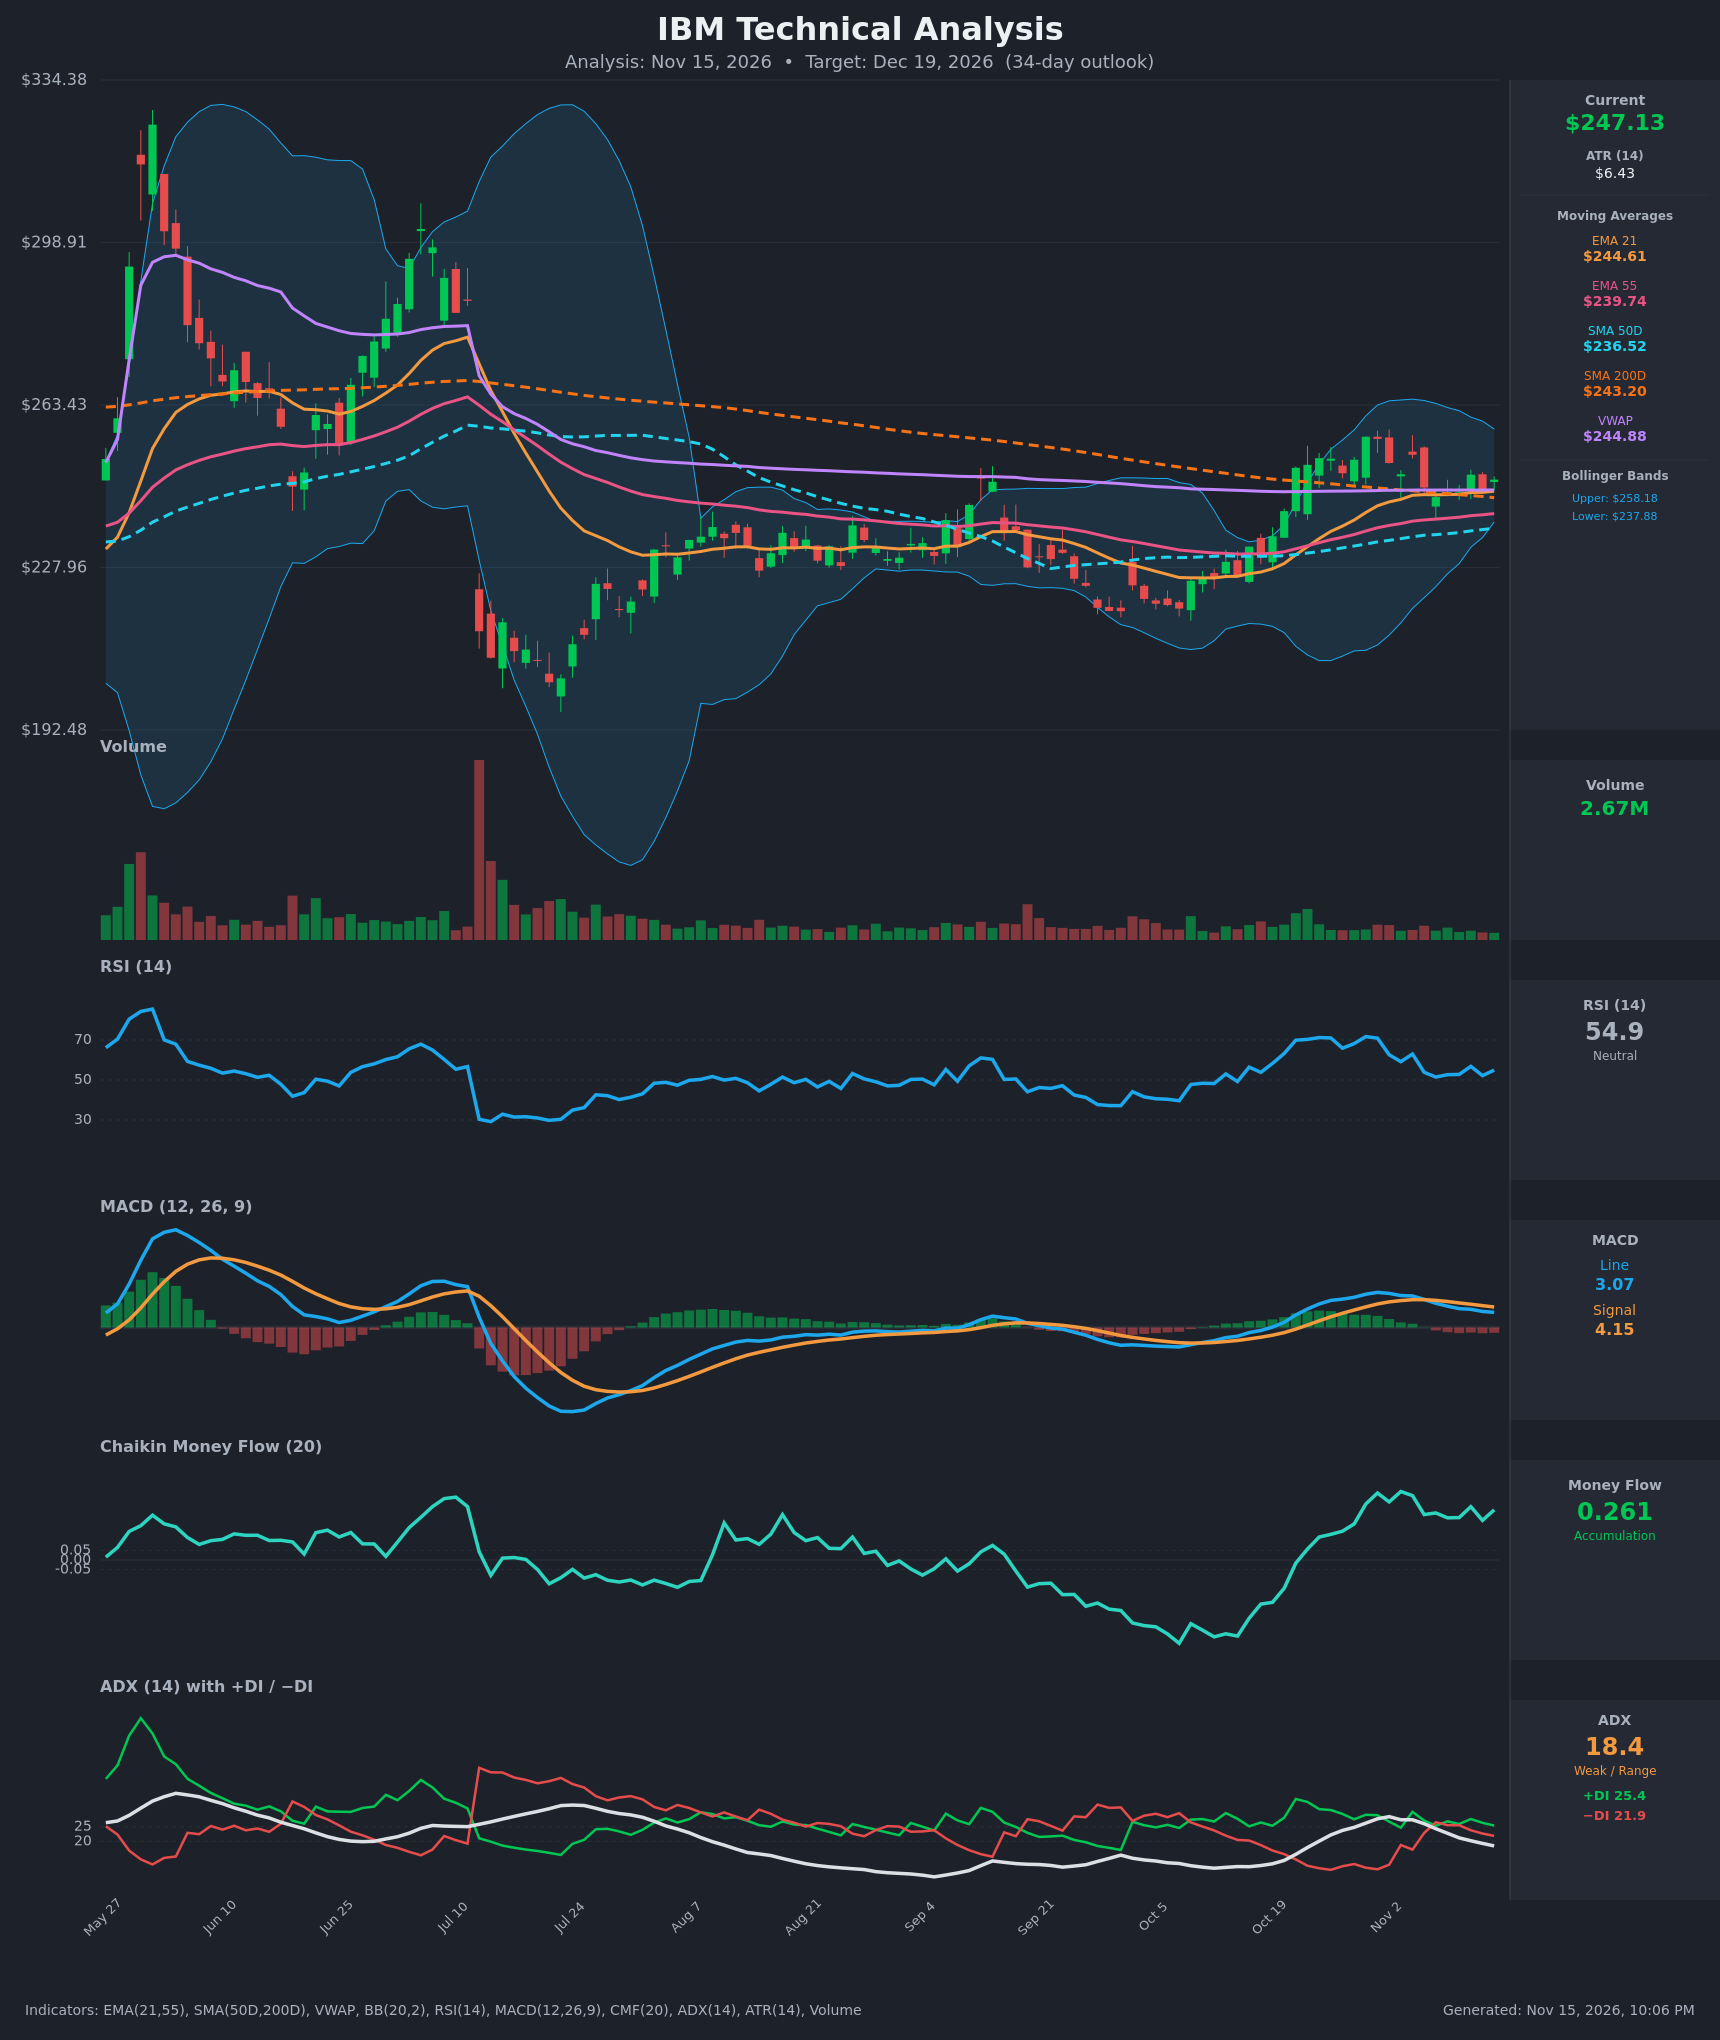
Analysis
TECHNICAL INDICATORS
- RSI (14): 54.93, near the midline. It has pulled back from 71 in late October and has been flat between 52 and 57 over the last week. Momentum is neutral with no overbought or oversold condition. [Neutral]
- 20 EMA (EMA 21): $244.61, with price at $247.13 just above it. The EMA is flattening after a steep climb, and price has bounced off it several times in the last week. EMA21 is above EMA55 ($239.74), so the short-term structure is intact. [Bullish]
- MACD: Line 3.07 is below Signal 4.15, so the histogram is negative and widening slightly. The bearish crossover happened around Nov 5, and the line has been falling from a 7.1 peak. Momentum is fading, though the line is still above zero. [Bearish]
- Bollinger Bands (20): Upper $258.18, lower $237.88, middle about $248. Price sits almost exactly on the midline. The band width of about 8% is moderate and has narrowed from the October expansion. The upper band is near the Oct 29-30 highs of about $256. [Neutral]
- CMF (20): +0.261, well above +0.05 and sustained positive since mid-October. It has recovered from deep distribution in September and shows persistent buying pressure even during the pullback. [Accumulation]
- ADX (14): 18.4 and falling from 28.4, so the trend is weak or range-bound. +DI (25.4) is only slightly above −DI (21.9), so the bullish edge is narrow after the DI spread compressed. [Weak Trend, slight bullish lean]
- Volume: 2.67M, light and below the recent average, with no expansion on the pullback. The only large spike on the chart was the July sell-off. The low-volume digestion suggests a pause rather than distribution. [Neutral / consolidation]
DIVERGENCES & TRENDS
- Price is holding around $244-$248, but MACD has made lower highs (7.1 to 3.1) and RSI has dropped from 71 to 55. This is momentum cooling and a mild bearish divergence, not a reversal signal.
- CMF is rising or holding near 0.26 while price consolidates. This is a mild bullish divergence in volume flow.
- Price, VWAP ($244.88), EMA21 ($244.61) and SMA200D ($243.20) are all clustered at $243-$245, which is a strong equilibrium zone.
- SMA50D ($236.52) is below SMA200D ($243.20) and rising toward it. A golden cross is possible in the coming weeks if the SMA50D keeps climbing, though price is not pushing higher quickly.
- Price has reclaimed SMA200D from below, which is a modest long-term positive.
- The MACD bearish crossover from Nov 5 and the ADX fade toward 18 suggest a range or digestion phase.
CHART PATTERNS
- The October rally to about $256 followed by a tight, sideways consolidation near the 200D SMA resembles a Bullish Flag / Pennant (continuation). The sideways pullback is shallow and on low volume, with higher lows from the Sep-Oct base.
- The larger structure from August to November is a rounded base, or a loose Ascending Triangle, with resistance at $256-$258 and rising lows near $236-$240.
- A breakout above $258 would project toward about $270, using the roughly $20 height of the base. Failure at the $256 resistance would put the $237-$240 support zone back in play.
- There is no clean reversal pattern, and a Bearish Double Top at $256 is only a minor risk (Oct 29-30 highs versus Nov 4 at about $252.57).
POTENTIAL SCENARIOS
- Scenario 1: Bullish Flag Breakout — Price holds EMA21/SMA200D, CMF accumulation continues and MACD re-crosses upward, leading to a push through the $256-$258 resistance. Trigger: close above $253 on rising volume, then above $258. Target: $262-$270. Invalidation: close below $240. (45% probability)
- Scenario 2: Neutral Range Digestion — Price chops between $238 and $256 as ADX stays below 20 and the 50D SMA closes in on the 200D SMA. Trigger: failed breaks of either boundary. Target: $244-$250. Invalidation: close above $258 or below $236. (30% probability)
- Scenario 3: Bearish Rollover — The MACD bearish crossover extends, −DI crosses above +DI, and price loses the cluster of EMA21, VWAP and SMA200D, falling toward the SMA50D and lower Bollinger Band. Trigger: close below $240 on rising volume. Target: $232-$237. Invalidation: reclaim of $250. (25% probability)
PRICE TARGETS
- Target Price: $252.00 (34-day outlook, ending Dec 19, 2026)
- Expected Range: $232.00 to $270.00 (width $38, about 15.4% of current price, consistent with the 30-60 day guidance of 12-18%)
- Key Levels: Support at $243.20 (SMA200D, with the EMA21 at $244.61 just above), Resistance at $258.18 (upper Bollinger Band, near the Oct 29-30 highs)
OVERALL BIAS
OVERALL BIAS: BULLISH - CMF accumulation (+0.26), price above all key averages and a shallow low-volume consolidation under resistance favor an upside breakout. The weak ADX and negative MACD histogram keep conviction modest and a range-bound outcome is a real risk.
This is educational analysis and not financial advice.