IBM 7-day bullish forecast — Oct 31, 2026
- Bias: Bullish
- Timeframe: 7 days (made Oct 31, 2026, target date Nov 6, 2026)
- Price at analysis: $257.86
- Price target: $259.80
- Expected range: $253.00 – $263.50
- Result: Incorrect (-5.0%) — closed at $245.00 on Nov 6, 2026; quality score 13/100
Get a free AI analysis of IBM today
Analysis
TECHNICAL INDICATORS
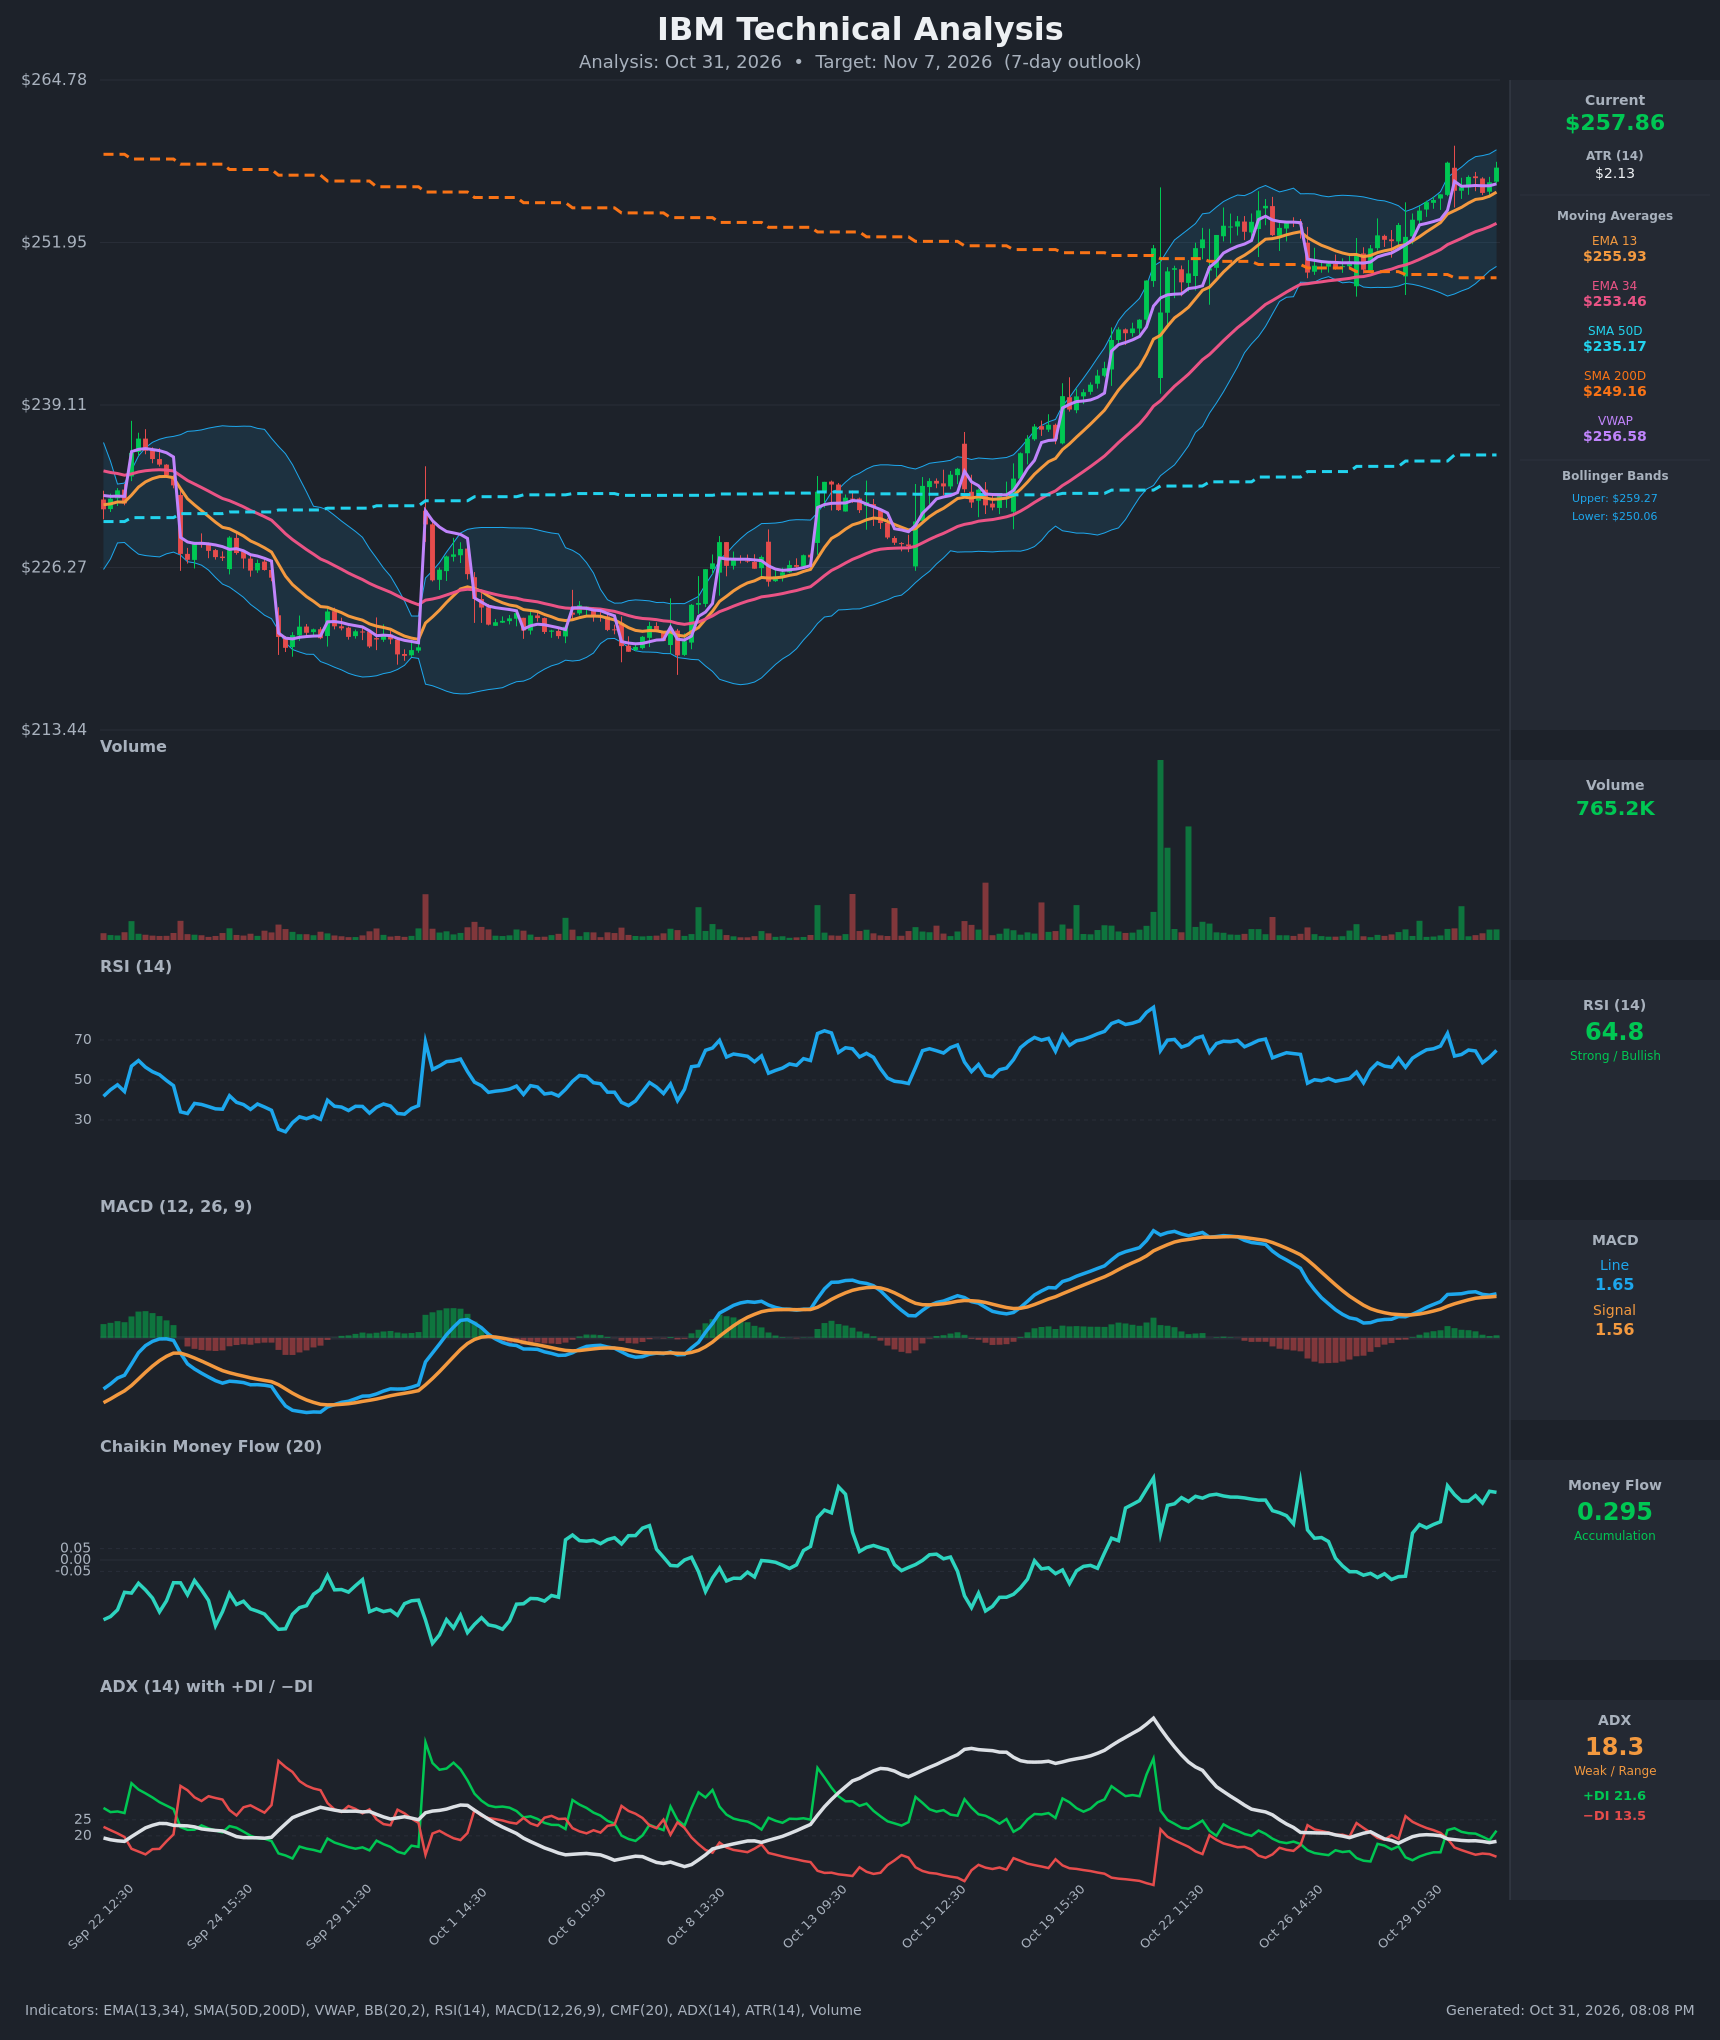
- RSI (14): 64.82, in the upper half of the range but below the 70 overbought line. It has pulled back from 73.3 on Oct 29 and is turning up again, so momentum is still constructive with some room before overbought. [Bullish]
- 20 EMA (EMA 13/34 used): EMA13 is $255.93 and EMA34 is $253.46. Price at $257.86 sits above both, and EMA13 is above EMA34 with a widening gap, so the short-term trend is up. The EMAs are dynamic support around $255.9 and $253.5. [Bullish]
- MACD: Line 1.655 is above signal 1.558, with a small positive histogram of about +0.10. The bullish crossover happened around Oct 29, and both lines are rising from near zero. The histogram is thin, so momentum is modest rather than explosive. [Bullish]
- Bollinger Bands (20): Upper $259.27, lower $250.06, midline about $254.66. Price is in the upper third of the bands, about $1.41 below the upper band. The bands are fairly narrow after the consolidation and are starting to expand upward, with price walking the upper half. [Bullish]
- CMF (20): 0.295, well above +0.05 and sustained since Oct 29 (from -0.07 to about 0.3). This is strong accumulation and buying pressure. [Accumulation]
- ADX (14): 18.3, below 20, so trend strength is weak and fading from the earlier peak. +DI (21.6) is above −DI (13.5), so bulls have directional control after the Oct 29 DI crossover. The trend is directionally bullish but not yet strong. [Weak Trend + Bullish direction]
- Volume: 765.2K, ordinary relative to the recent bars and well below the mid-October spike. Recent up-moves are not on heavy volume, so participation is moderate and does not confirm a breakout. [Neutral to mildly supportive]
Moving average and VWAP context:
- Price is above SMA200D ($249.16) and SMA50D ($235.17), both rising, so the long-term uptrend is intact. SMA50D crossed above SMA200D earlier, so a golden cross is already in place (SMA50D is still well below SMA200D numerically, so treat this cautiously and rely on price over SMA200D).
- Price is above VWAP ($256.58) by about $1.28, which indicates buyers have the advantage intraday.
DIVERGENCES & TRENDS
- There is no clear bearish RSI divergence. RSI peaked at 73.3 on Oct 29 and is now 64.8 while price is at a new high, a mild lower-high in RSI against a higher price high. This is an early caution flag but not a confirmed divergence.
- MACD is making a higher-low bullish turn from its late-October trough, and the signal-line crossover is recent and positive.
- CMF has swung from negative to strongly positive while price broke higher, which confirms the move.
- ADX is falling (about 18) even as price rises. The trend is grinding rather than accelerating, which argues for a slower, steadier move.
- DI: +DI crossed above −DI on Oct 29 and the spread is widening (21.6 vs 13.5).
- The EMA13/EMA34 bullish alignment has held, and price has been making higher highs and higher lows since Oct 9.
CHART PATTERNS
- Price rallied from about $226 to $258 and then consolidated around $252-$257 for several sessions. This resembles a Bullish Flag / Pennant (continuation), and the recent break to new highs argues for continuation.
- The measured move from the flagpole is large, but a 7-day horizon will likely capture only part of it. A conservative target is the $260-$263 area, with the upper Bollinger Band at $259.27 as the first hurdle.
- The mid-range consolidation produced no confirmed reversal pattern such as a double top. A top would need a failure below $255 to be taken seriously.
POTENTIAL SCENARIOS
- Scenario 1: Bullish Flag Continuation — Price holds above the EMA13 and VWAP and breaks the upper Bollinger Band on strong CMF and positive MACD. Trigger: close above $259.30 with volume. Target: $262.00-$264.00. Invalidation: close below $254.50. (50% probability)
- Scenario 2: Neutral Consolidation Near Highs — Weak ADX and an upper-band stall keep price chopping between the EMAs and the upper band. Trigger: failure to clear $259.30 with RSI flat around 60-65. Target: $255.00-$259.00. Invalidation: close above $260 or below $253. (28% probability)
- Scenario 3: Bearish Pullback — RSI's lower high and low volume lead to profit-taking back toward the EMA34 and the Bollinger midline. Trigger: close below $255.50 with MACD crossing under signal. Target: $251.00-$253.50. Invalidation: reclaim of $257.50 on rising volume. (22% probability)
PRICE TARGETS
- Target Price: $259.80 (7-day horizon)
- Expected Range: $253.00 to $263.50 (width $10.50, about 4.1% of current price, consistent with the 4-8% guidance for 7-10 days)
- Key Levels: Support at $255.90 (EMA13; next at $253.46 EMA34), Resistance at $259.27 (upper Bollinger Band; next at $262.00)
OVERALL BIAS
OVERALL BIAS: BULLISH - Price is above all key moving averages and VWAP with a fresh MACD bullish crossover, +DI over −DI and strong CMF accumulation (0.295). The weak ADX and the mild RSI lower high limit the upside, so expect a measured grind higher toward about $260.
This is educational analysis and not financial advice.