NOK 4-day bearish forecast — Nov 1, 2026
- Bias: Bearish
- Timeframe: 4 days (made Nov 1, 2026, target date Nov 4, 2026)
- Price at analysis: $8.54
- Price target: $8.42
- Expected range: $8.26 – $8.68
- Result: Correct (-3.3%) — closed at $8.26 on Nov 4, 2026; quality score 100/100
Get a free AI analysis of NOK today
Analysis
TECHNICAL INDICATORS
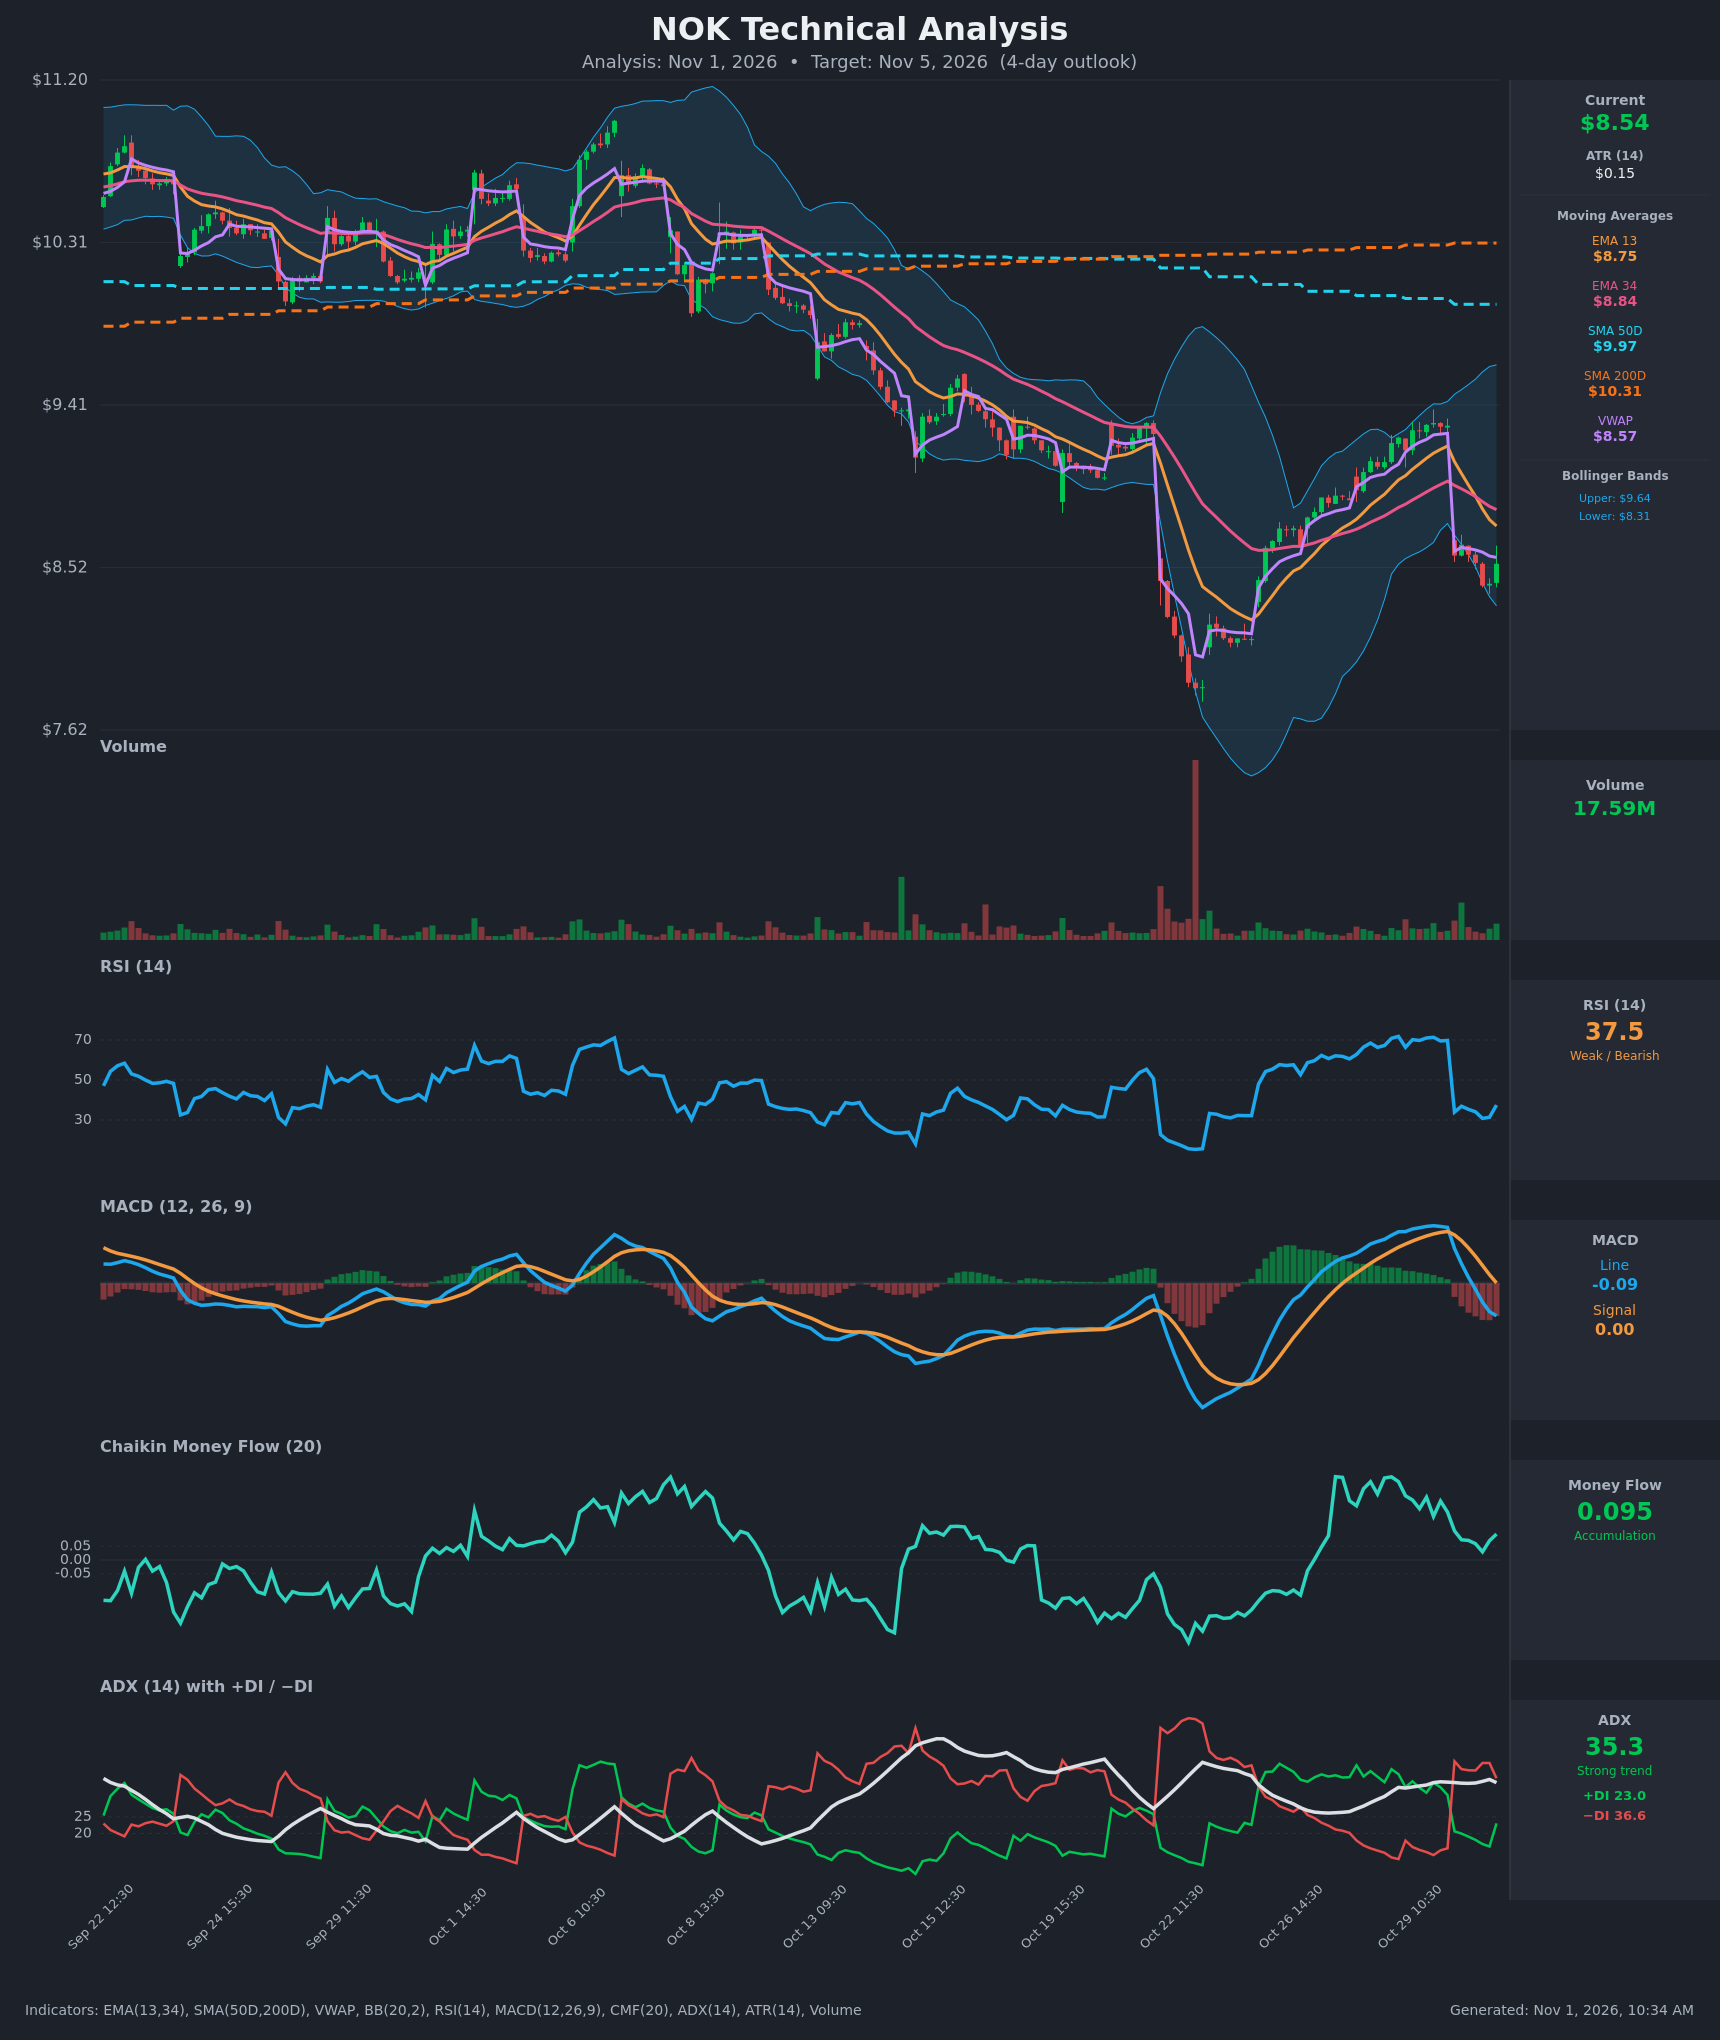
- RSI (14): 37.46. It fell from about 70 to about 31 after the Oct 30 gap-down and is now bouncing slightly off the low. It is still below 50 and has not reached oversold. [Bearish]
- 20 EMA: The data gives EMA 13 at $8.75 and EMA 34 at $8.84, and price at $8.54 is below both. EMA13 crossed below EMA34 around Oct 30 12:30 and both are now sloping down, so they act as overhead resistance. [Bearish]
- MACD: The line at -0.095 crossed below the signal at 0.001 on Oct 30 12:30. The histogram is negative and has been expanding to the downside, with no sign of a turn yet. [Bearish]
- Bollinger Bands (20): Upper $9.64, lower $8.31. Price sits in the lower quarter of the band, about $0.23 above the lower band. The bands are wide after the volatile gap, so a tag of the lower band is possible and a bounce from it would be only a relief move. [Neutral]
- CMF (20): 0.095, above the +0.05 threshold, but it has faded from 0.29 and is ticking back up. Buying pressure is still present despite the drop, which is the main bullish counterpoint. [Accumulation]
- ADX (14): 35.3 with −DI at 36.6 above +DI at 23.0. The trend is strong and bears are in control. +DI turned up slightly on the last bar, but the −DI/+DI gap is still wide. [Strong Trend – Bearish]
- Volume: 17.59M on the latest bar, which is elevated relative to the typical bars on the chart. The last bar is green, so there may be modest dip buying, but there is no capitulation spike like the one near Oct 22. [Mildly supportive of a bounce, not a reversal]
- VWAP / SMAs: VWAP is $8.57, just above price, so price is trading under VWAP (mild selling pressure). SMA50 at $9.97 and SMA200 at $10.31 are far above, with a death-cross structure (50 below 200). Price is in a long-term downtrend. [Bearish]
DIVERGENCES & TRENDS
- No clear divergence. RSI and MACD confirm the price decline, and CMF stays positive. That mild mismatch suggests selling is not heavily distributive, but it is not a divergence signal.
- The Oct 30 gap-down from $9.30 to $8.59 wiped out the Oct 22–29 rally. It reversed RSI from about 70 to about 34 in one bar.
- The EMA13/EMA34 bearish cross and the MACD bearish cross both occurred within the last few bars, so momentum has just shifted down.
- The DI lines flipped from +DI dominant to −DI dominant on the gap, with ADX holding above 35.
- Price is well below SMA50 and SMA200, so the long-term trend is down. Rallies tend to stall at the moving averages.
CHART PATTERNS
- Bearish Flag / Pennant (small): After the sharp gap-down (the flagpole), price is drifting in a tight range near $8.42–$8.64. A break below $8.42 would project toward $8.2–$8.3.
- Larger structure: The Oct 22 low near $7.9 followed by a rally to $9.30 that failed under the SMA50 resembles a failed recovery (a lower high versus the September levels), consistent with a bearish continuation. This is a loose resemblance rather than a textbook pattern.
- The price is not showing a confirmed reversal pattern such as a double bottom, so there is no confirmed bullish pattern.
POTENTIAL SCENARIOS
- Scenario 1: Bearish Continuation Lower — Price stays below the falling EMAs and VWAP, and −DI dominance keeps selling pressure on. Price breaks the Oct 30 low and drifts toward the lower Bollinger Band. Trigger: break and close below $8.42. Target: $8.30–$8.35, with an extension to about $8.20. Invalidation: close above $8.75 (EMA13). (50% probability)
- Scenario 2: Bullish Relief Bounce — Positive CMF, a green last bar and a nearly oversold RSI prompt a dead-cat bounce to the EMAs. Trigger: reclaim of VWAP $8.57 and a push through $8.65. Target: $8.75–$8.84 (EMA13/34). Invalidation: loss of $8.42. (35% probability)
- Scenario 3: Neutral Chop — Price consolidates between $8.42 and $8.64 as the gap digests. Trigger: failure to break either side with fading volume. Target: $8.50–$8.58. Invalidation: a decisive close outside the $8.40–$8.70 range. (15% probability)
PRICE TARGETS
- Target Price: $8.42 (4-day)
- Expected Range: $8.26 to $8.68 (width $0.42, about 4.9% of price, which fits the 3–5% scale for a 4-day window and is about 1.4 times the 4-day ATR-implied move)
- Key Levels: Support at $8.31 (lower Bollinger Band; the Oct 30 low is $8.42 just above it), Resistance at $8.75 (EMA13, with VWAP at $8.57 as the first hurdle)
OVERALL BIAS
OVERALL BIAS: BEARISH - Price is below all key moving averages and VWAP, MACD and EMA13/34 just crossed down, and ADX at 35 with −DI above +DI confirms a strong downtrend. Positive CMF and a near-oversold RSI argue for a possible bounce, so conviction is moderate.
This is educational analysis and not financial advice.